Properties (17)
- purpleRed
- (Andermane et al., 2023)
- Misophonia
- Phenomenological cartography
- Hyperacusis
- ASMR
- Visual analog scale
- Scrambled sounds
A phenomenological cartography of misophonia and other forms of sound intolerance
Status:: #status/Bare-bones-review
Metadata
- Item Type: #journalArticle
- Authors:: Nora Andermane, Mathilde Bauer, Ediz Sohoglu, Julia Simner, Jamie Ward,
- Date Added: 1758770805000
- URL: https://linkinghub.elsevier.com/retrieve/pii/S2589004223003760
- DOI:: 10.1016/j.isci.2023.106299
- Cite Key: andermanePhenomenologicalCartographyMisophonia2023
- Tags:: #descriptive, #Diagnosis, #Misophonia, #Phenomenology,
- PDF Attachments
Abstract
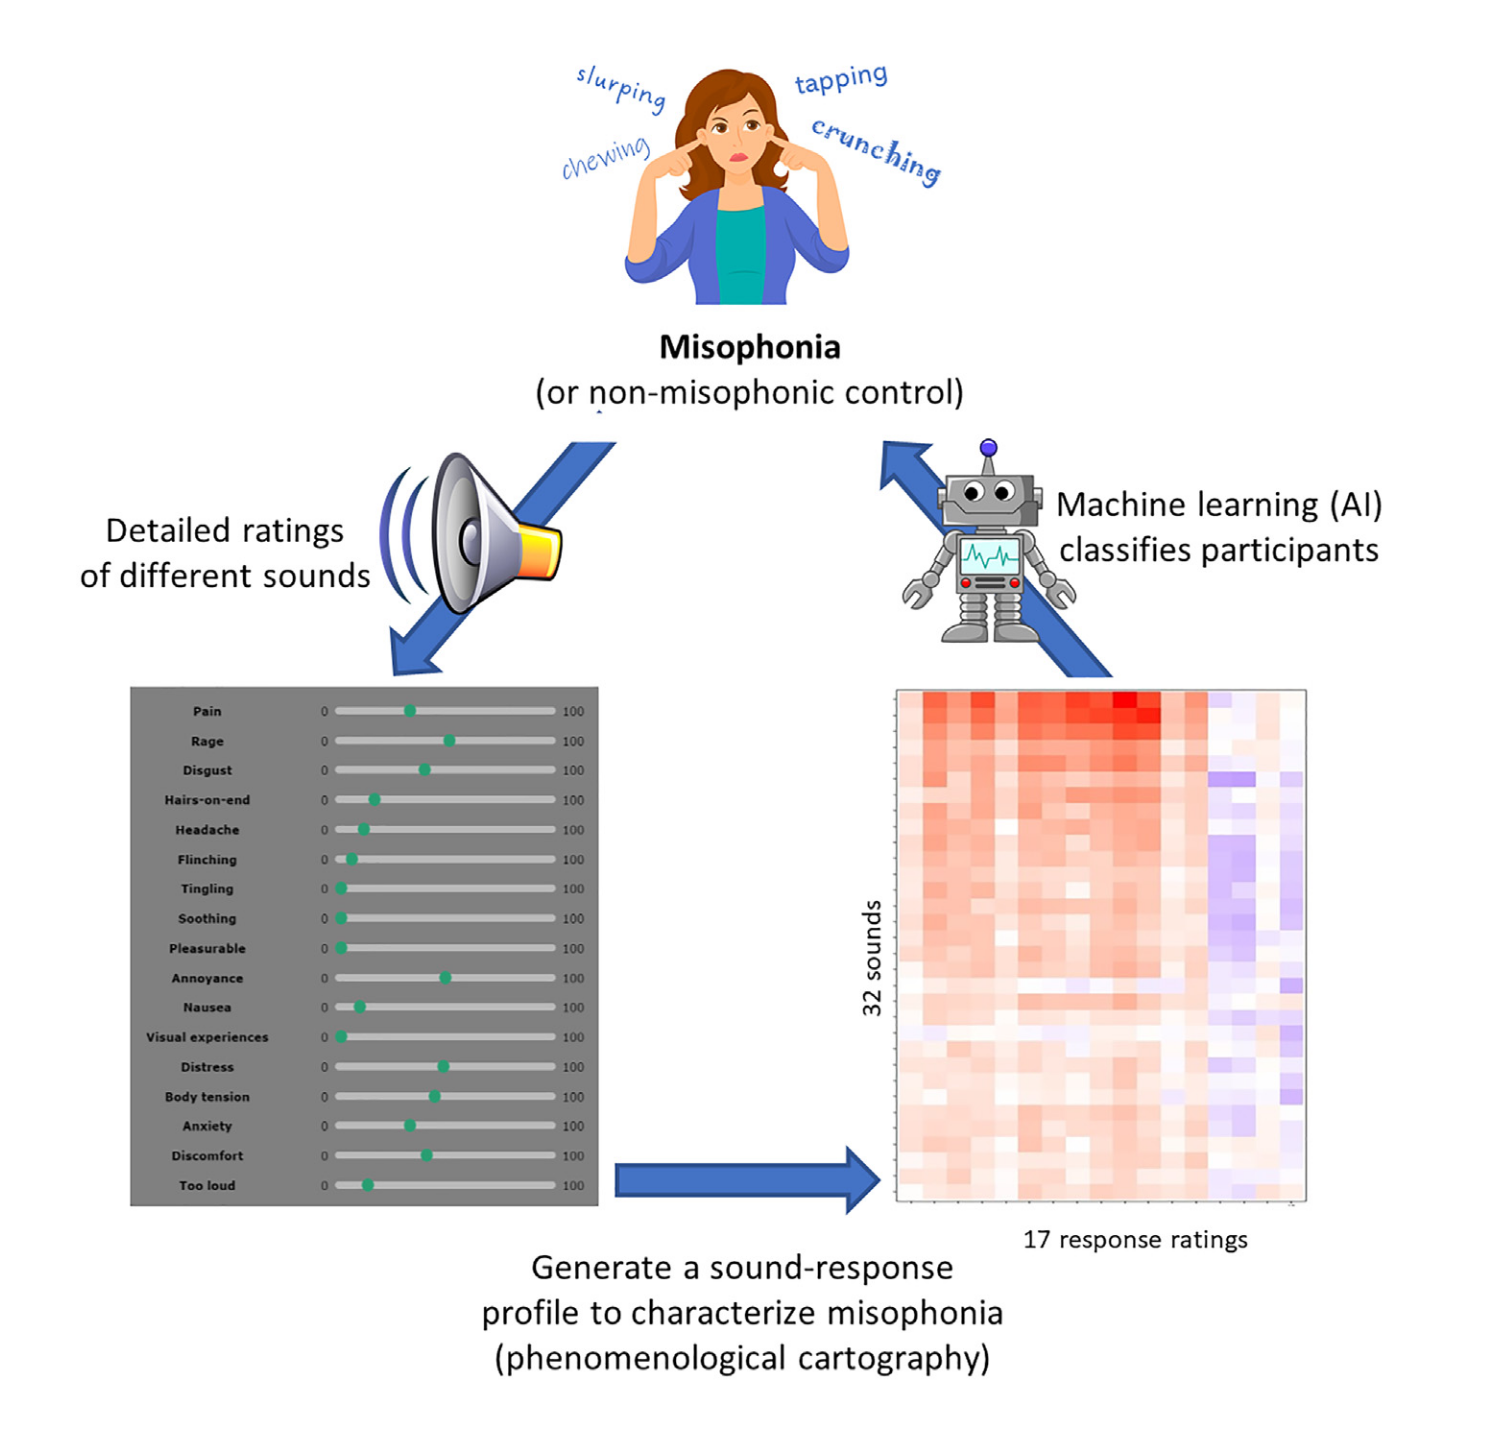
| Background/Purpose | Background- • Misophonia is typically understood as a highly specific aversion to certain trigger sounds, with some neuroimaging evidence supporting specificity. • Contradictory evidence suggests misophonics rate a broad range of sounds as more aversive, even those not traditionally described as triggers. • There is ongoing debate about whether misophonia reflects specific sound aversions or generalized sound intolerance. • A need exists for differential diagnosis among various forms of sound intolerance (e.g., misophonia, hyperacusis, phonophobia, autism-related sensitivities, ASMR). Purpose- • To determine whether misophonia is characterized by specific responses to specific sounds or a generalized aversive profile across many sounds. • To examine whether these sound-response profiles are distinct from those associated with hyperacusis, autism spectrum traits, or ASMR. • To apply a novel machine learning-based approach (phenomenological cartography) to assess misophonia diagnosis and its relationship to other sound intolerance profiles. |
| Participants/samples | • N = 418 participants (222 Misophonics, 196 controls) • Misophonics: Mean age = 41.56, SD = 14.32; 175F/42M/5NB • Controls: Mean age = 33.08, SD = 14.29; 140F/55M/1NB • Misophonia group identified using Sussex Misophonia Scale (SMS); threshold > 50.5. • Separate ASMR sample: N = 254; Mean age = 23.2; 202F/45M/7NB • Inclusion/Exclusion:- Based on SMS and ASMR-15 scores; additional self-report on traits like hyperacusis and autism. |
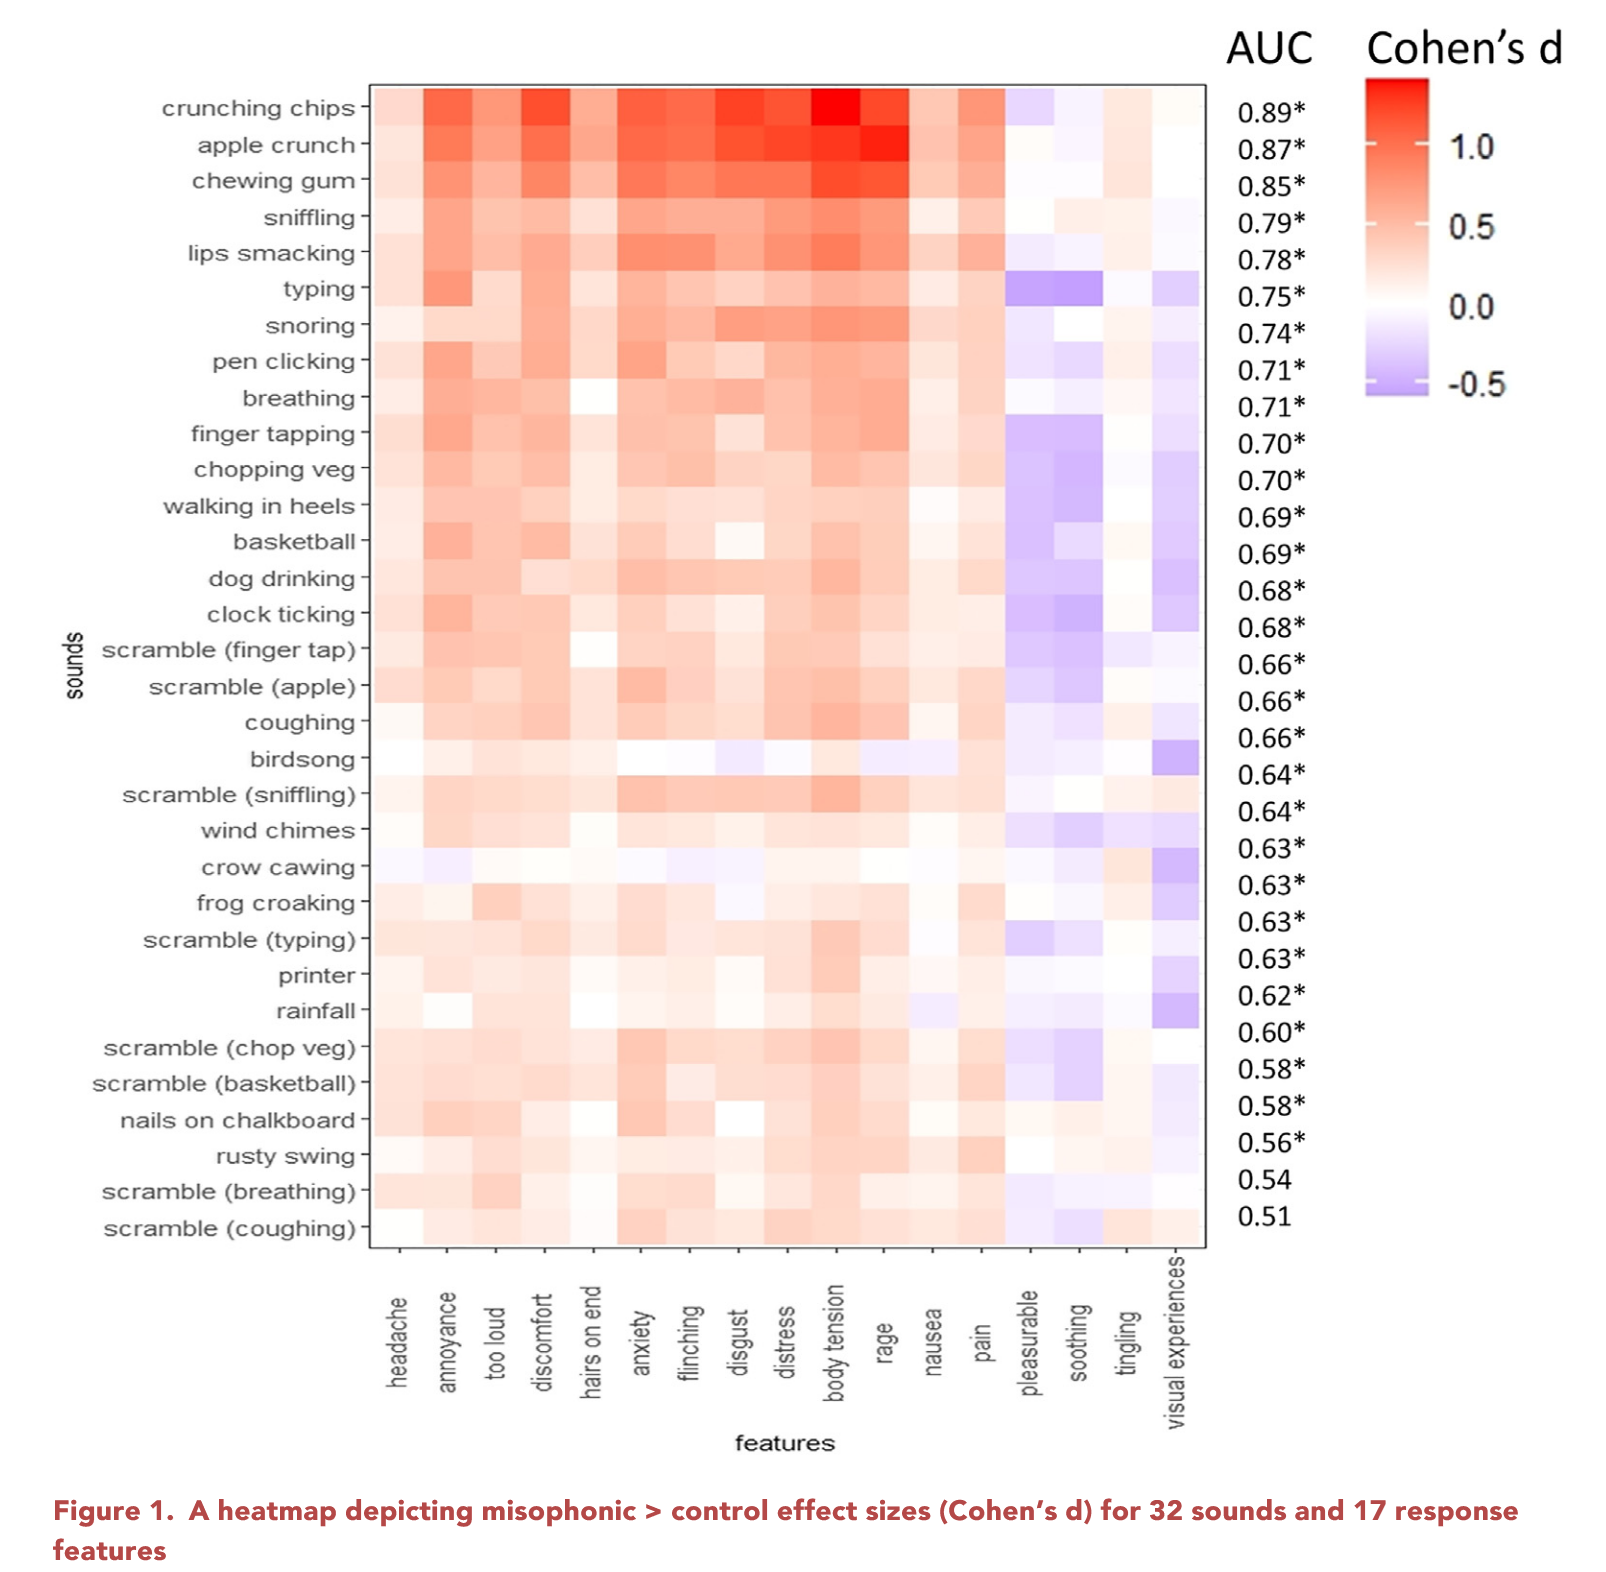
| Measures | • 17 subjective response descriptors rated per sound: e.g., rage, anxiety, disgust, soothing, pleasurable, body tension, etc. • Sounds rated using 0–100 visual analog scale. • Sussex Misophonia Scale (SMS) • Autism Spectrum Quotient (AQ), Sensory Sensitivity (GSQ), Interoceptive Awareness (MAIA) • ASMR-15 scale for assessing ASMR responsiveness stimuli- • Human oral/nasal sounds (8): chewing apple, eating crisps, chewing gum, lip smacking, coughing, snoring, breathing, sniffling. • Other human-made sounds (8): basketball dribbling, chopping vegetables, pen clicking, finger tapping, nails on chalkboard, rusty swing, typing, walking in heels. • Non-human sounds (8): bird song, clock ticking, crow cawing, dog drinking, frog croaking, printer noise, rainfall, wind chimes. • Scrambled sounds (8): temporally scrambled versions of apple eating, breathing, coughing, sniffling, basketball, chopping vegetables, finger tapping, typing. Scrambling preserved spectral content but disrupted recognizability. • ASMR Triggers (8 sounds): whispering, popping, rustling, tapping, and similar stimuli identified via ASMR forums. Tested separately in the ASMR group. |
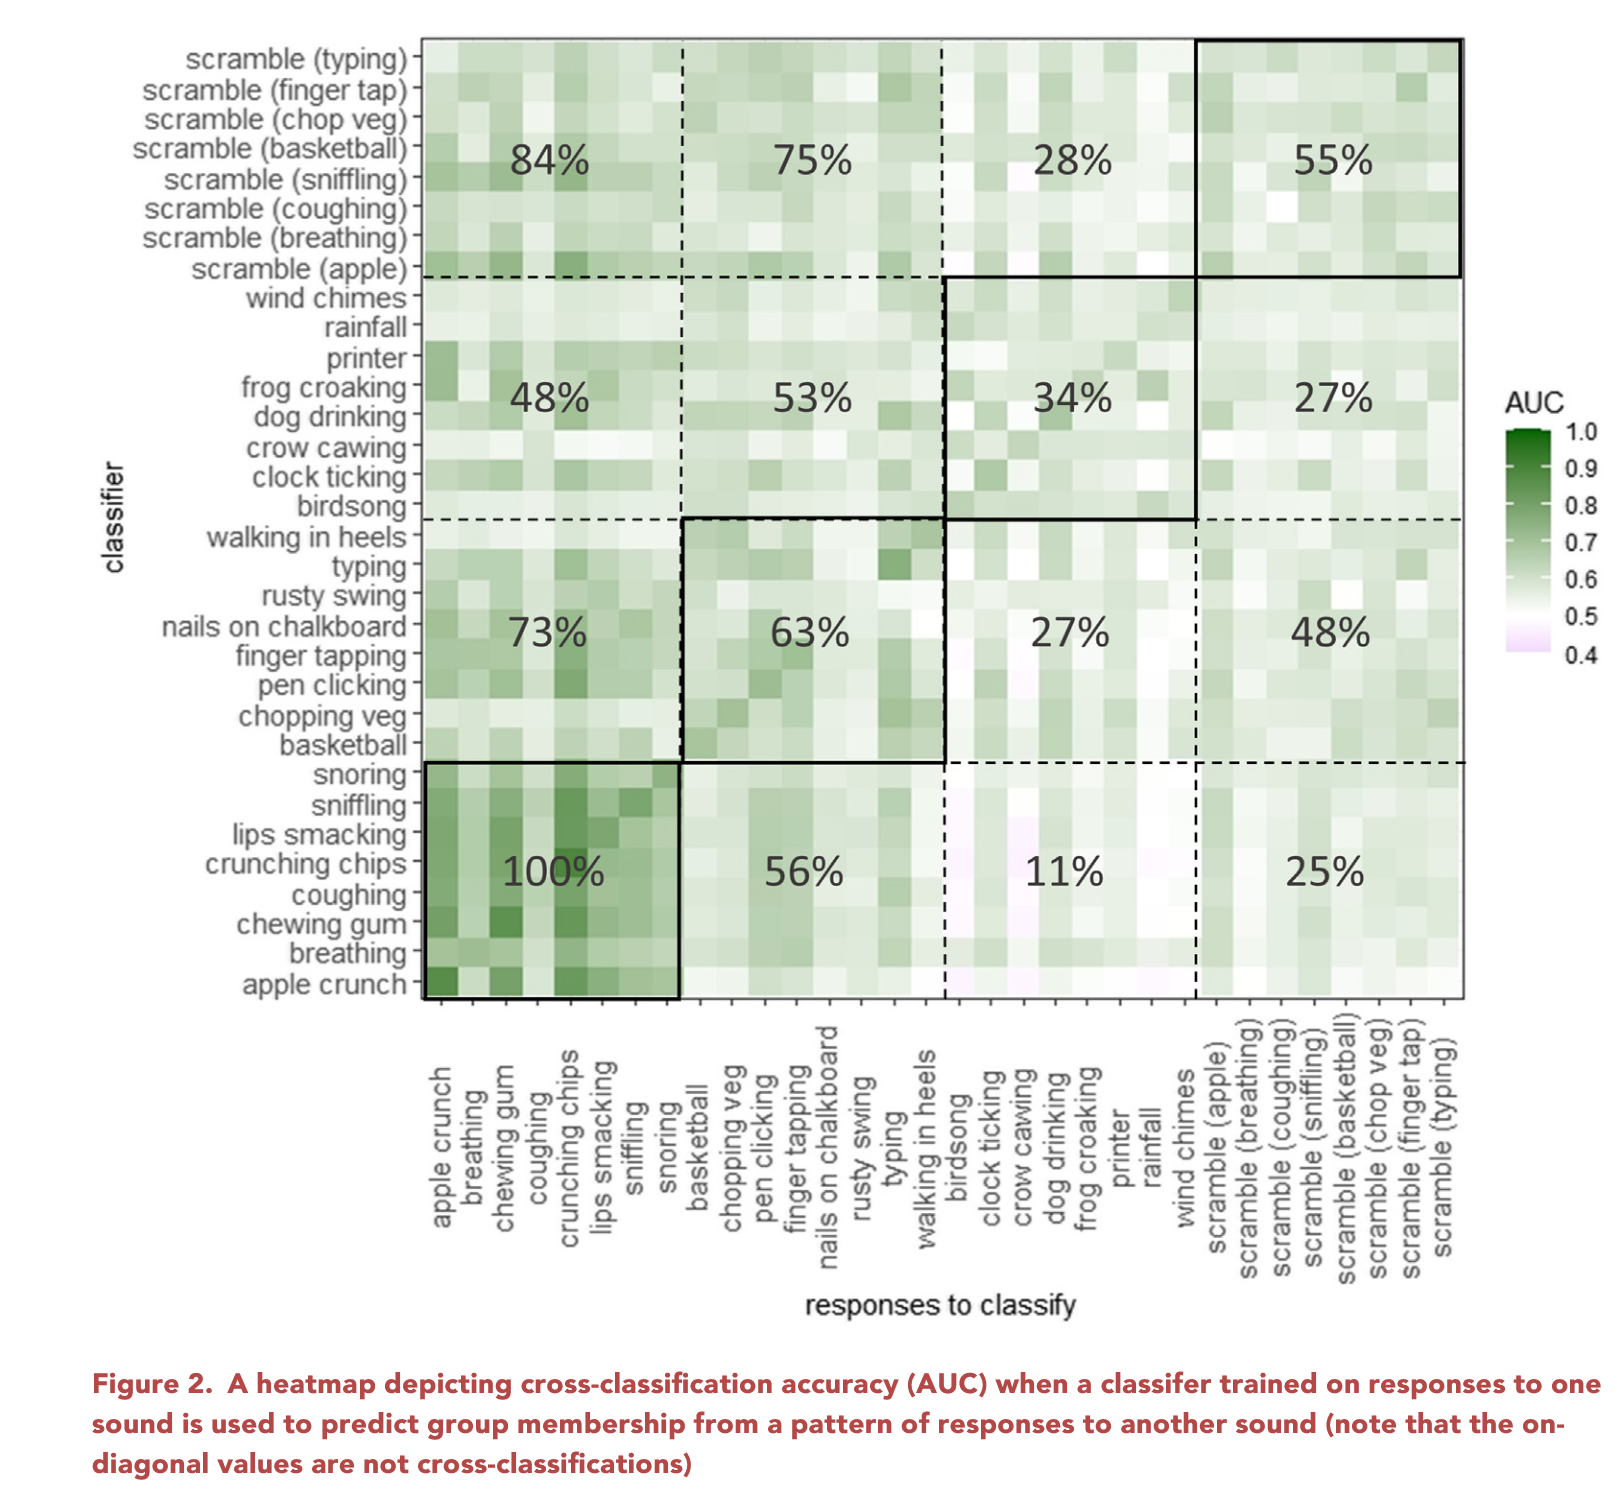
| Procedures | • Participants seated with headphones in a controlled environment. • Each sound clip lasted 15 seconds; participants rated it immediately after listening. • Ratings collected on a 0–100 visual analog scale across 17 descriptors (rage, anxiety, disgust, soothing, pleasurable, body tension, etc.). • The order of sounds was randomized for each participant to control for sequence effects. • Loudness of some clips was adjusted based on pilot testing to ensure equal perceived volume across stimuli. • Scrambled sounds were included to act as acoustic controls, testing reactions independent of recognizability. • In ASMR-specific testing, participants were also exposed to 8 ASMR triggers alongside the 32 main sounds. • Machine learning classifiers (random forest-based) were trained separately per sound and tested using cross-validation. • Cross-classification was applied: a classifier trained on responses to one sound (e.g., chewing apple) was tested on responses to another (e.g., chewing gum). |
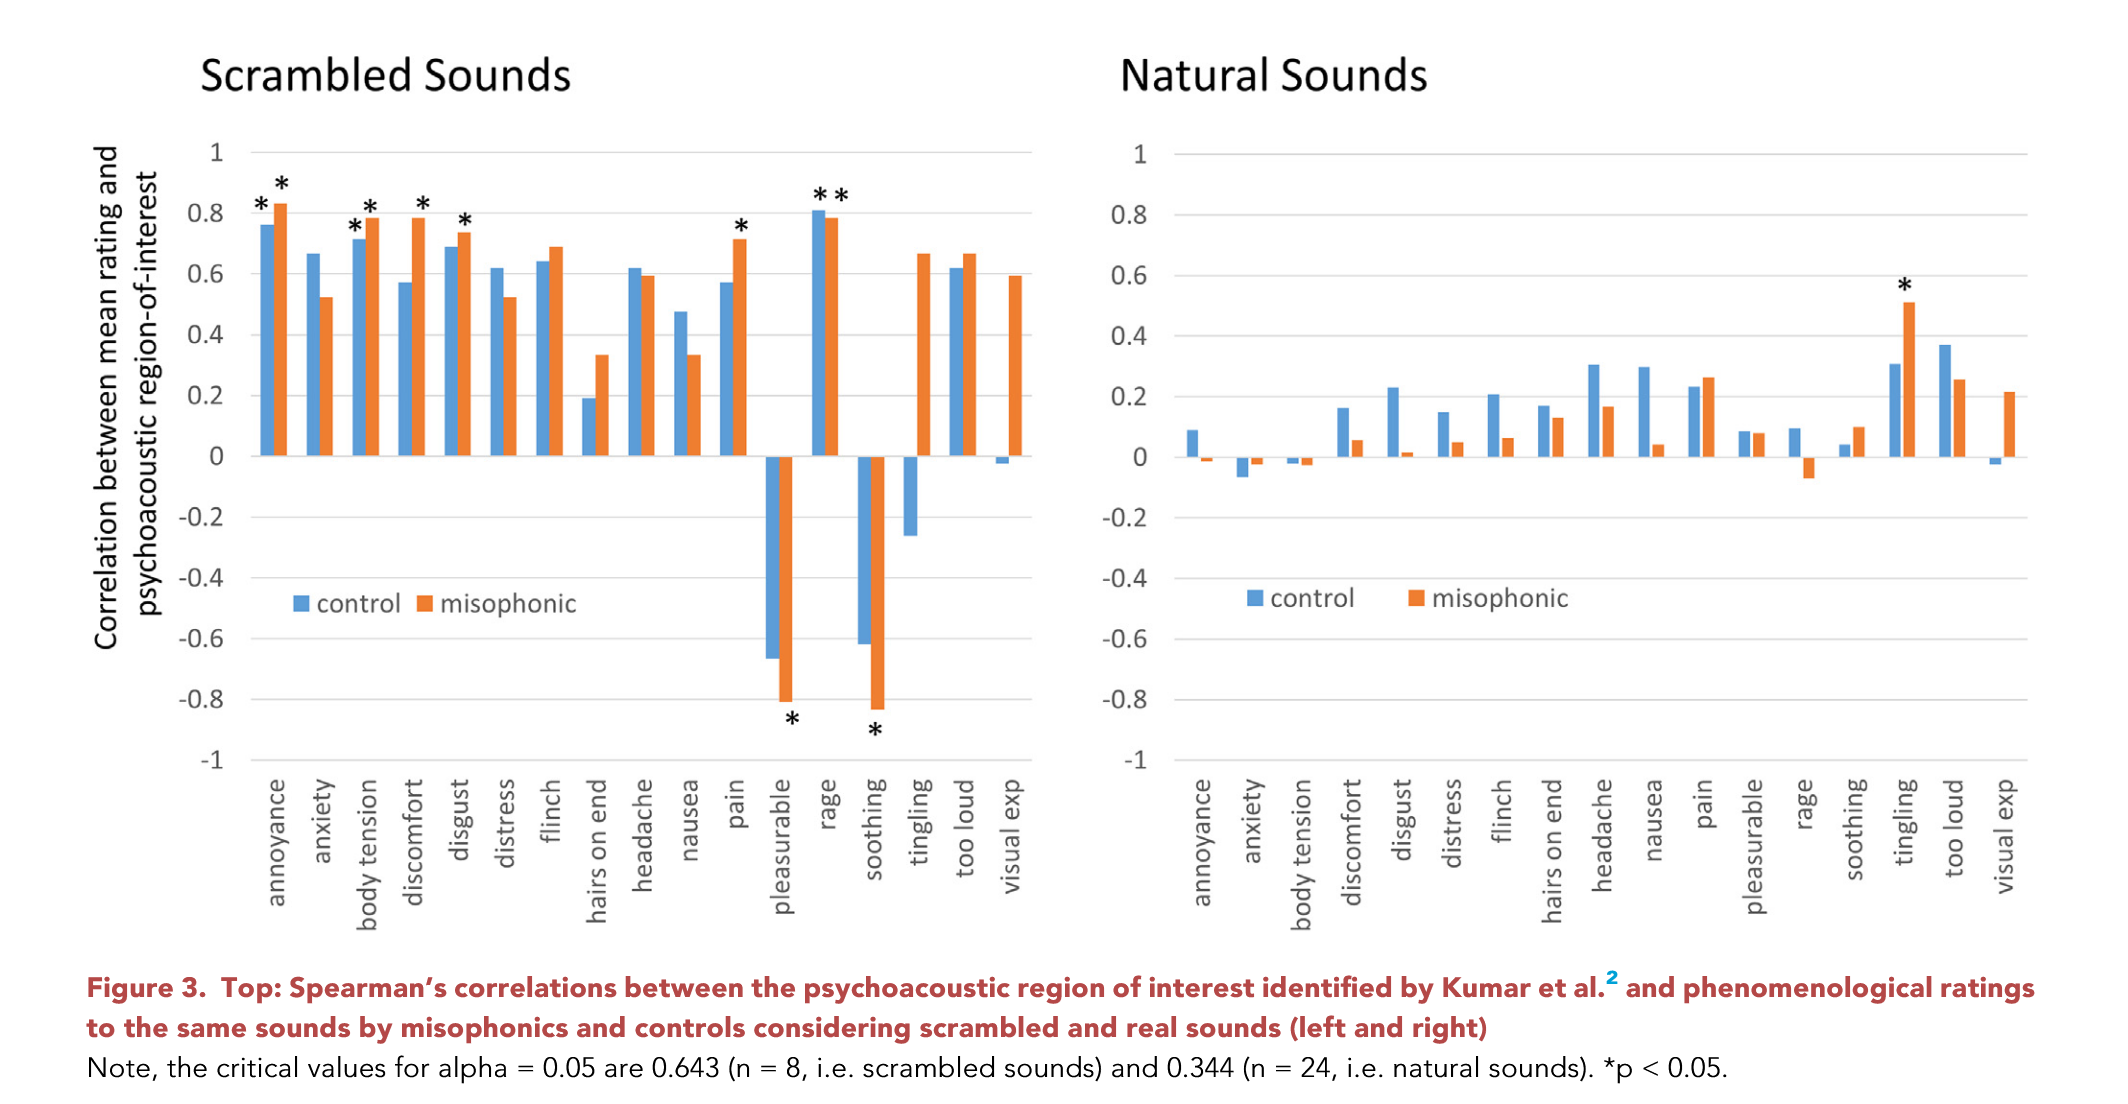
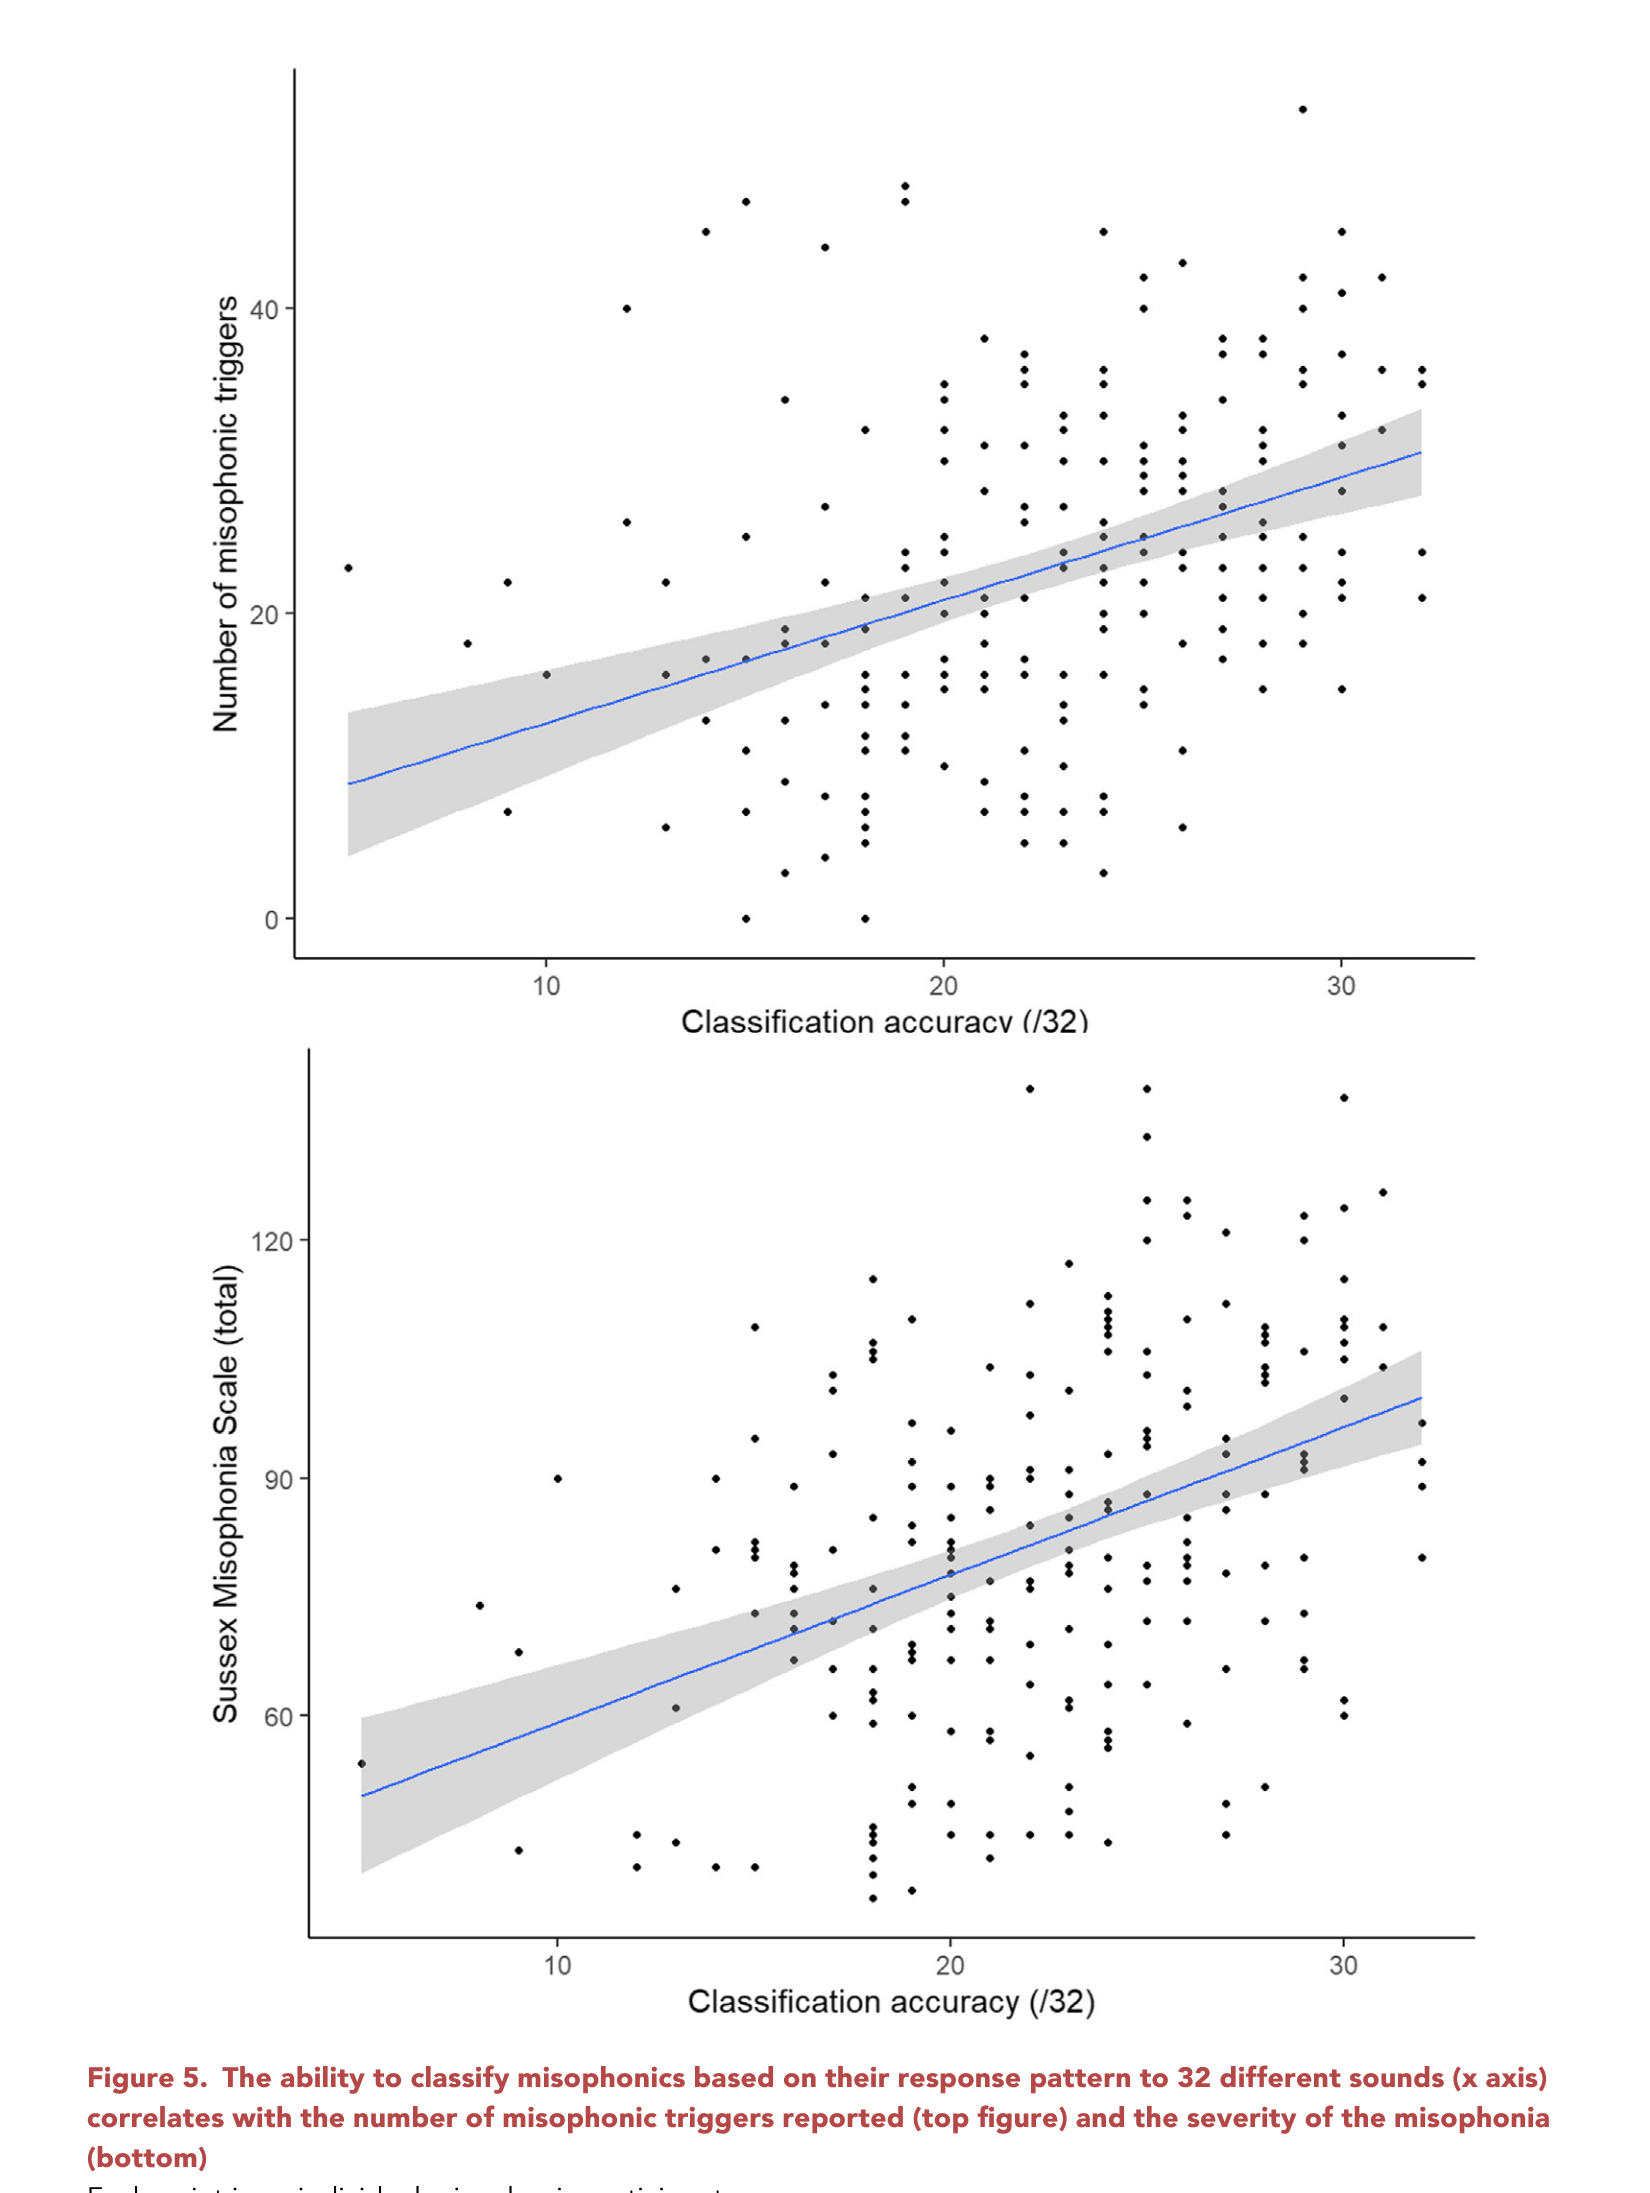
| Results | • 30 of 32 sounds classified Misophonics vs. controls above chance (AUC > 0.5) • Overall classifier accuracy AUC = 0.925 (specificity = 0.865, sensitivity = 0.802) • Most predictive features: body tension, annoyance, anxiety, rage • Misophonics show broad sound intolerance, not just to traditional triggers • Cross-classification (i.e., using response to one sound to classify others) showed generalized response patterns • Scrambled sounds elicited strong responses, supporting general sensitivity hypothesis • Psychoacoustic features (2500–5500 Hz and 1–16 Hz modulations) only weakly associated with aversive responses, especially for natural (recognizable) sounds • Severity of misophonia correlated with number of sounds triggering classification, suggesting less specificity with more severe symptoms |
| Discussion/Limits | Conclusion- • Misophonia reflects a generalized pattern of sound intolerance, with greater severity linked to broader intolerance. • Phenomenological cartography enables effective classification and insight into subjective response profiles. • Misophonia is distinct from other sound sensitivity profiles like hyperacusis, autism, and ASMR. • ASMR and misophonia do not co-occur meaningfully; profiles are distinct and sometimes oppositional. • Visual imagery responses were reduced in misophonics, possibly indicating attentional focus on internal states. |
| Limitations:: | • Black box nature of machine learning limits interpretability • Need for clinical validation of comorbid groups (autism, hyperacusis) • Limited generalizability across cultures and demographics • Use of only one psychoacoustic feature to explain responses |
| Future Directions:: | • Explore additional psychoacoustic features • Test cross-cultural generalizability • Investigate clinical groups with comorbid sound intolerances • Develop treatment strategies based on redirecting attention (e.g., visualizing sound source) |
| Relevance:: | • provides a interesting method of assessing misophonia through sound response profiles. the authors called it “phenomenological cartography” • shows evidence that Misophonics can be meaningfully identified by response profiles to a variety of sounds, not just trigger stimuli. • has a wealth of supplemental materials, including the stimuli used. could be a good source for materials in a future project |
Notes
key terms and concepts
-
Misophonia - a condition characterized by intense aversive reactions to specific trigger sounds, often oral/nasal human sounds (e.g., chewing, breathing).
-
Phenomenological cartography - a method used to map subjective first-person responses to sounds across multiple descriptors using machine learning to detect patterns.
-
Hyperacusis - a condition where normal environmental sounds are perceived as excessively loud or painful.
-
ASMR (Autonomous Sensory Meridian Response) - a condition involving pleasurable tingling sensations triggered by certain auditory or visual stimuli.
-
Scrambled sounds - acoustically similar but temporally altered versions of real sounds, used to test recognition-independent responses.
-
Visual analog scale- a rating method where participants quantify their responses on a continuum (0–100).
my engagement notes
my questions
my comments
- the authors used “random forest” to determine the features for the classifier. I have heard of the term on some stats YouTube vids but do not fully understand the concept., I should prolyl look into it? (page 4)
Bookmarks
- bookmark for breaking down the phenomenological cartography of misophonia (page 3)
- bookmark for Comparisons between sounds: Cross-classification (page 5)
- bookmark for speculation on why some sounds are rated highly (page 6)
- bookmark to the supplemental materials table (page 17)
- bookmark for in depth description of the sourcing of the stimuli (page 18)
- bookmark talking about the Psychoacoustic properties of the sounds (page 20)
reading notes
Severity Insights:
- Higher SMS scores correlate with broader range of aversive sound responses
- Machine learning performance tracks symptom severity, supporting validity of tool
Diagnostic Differentiation:
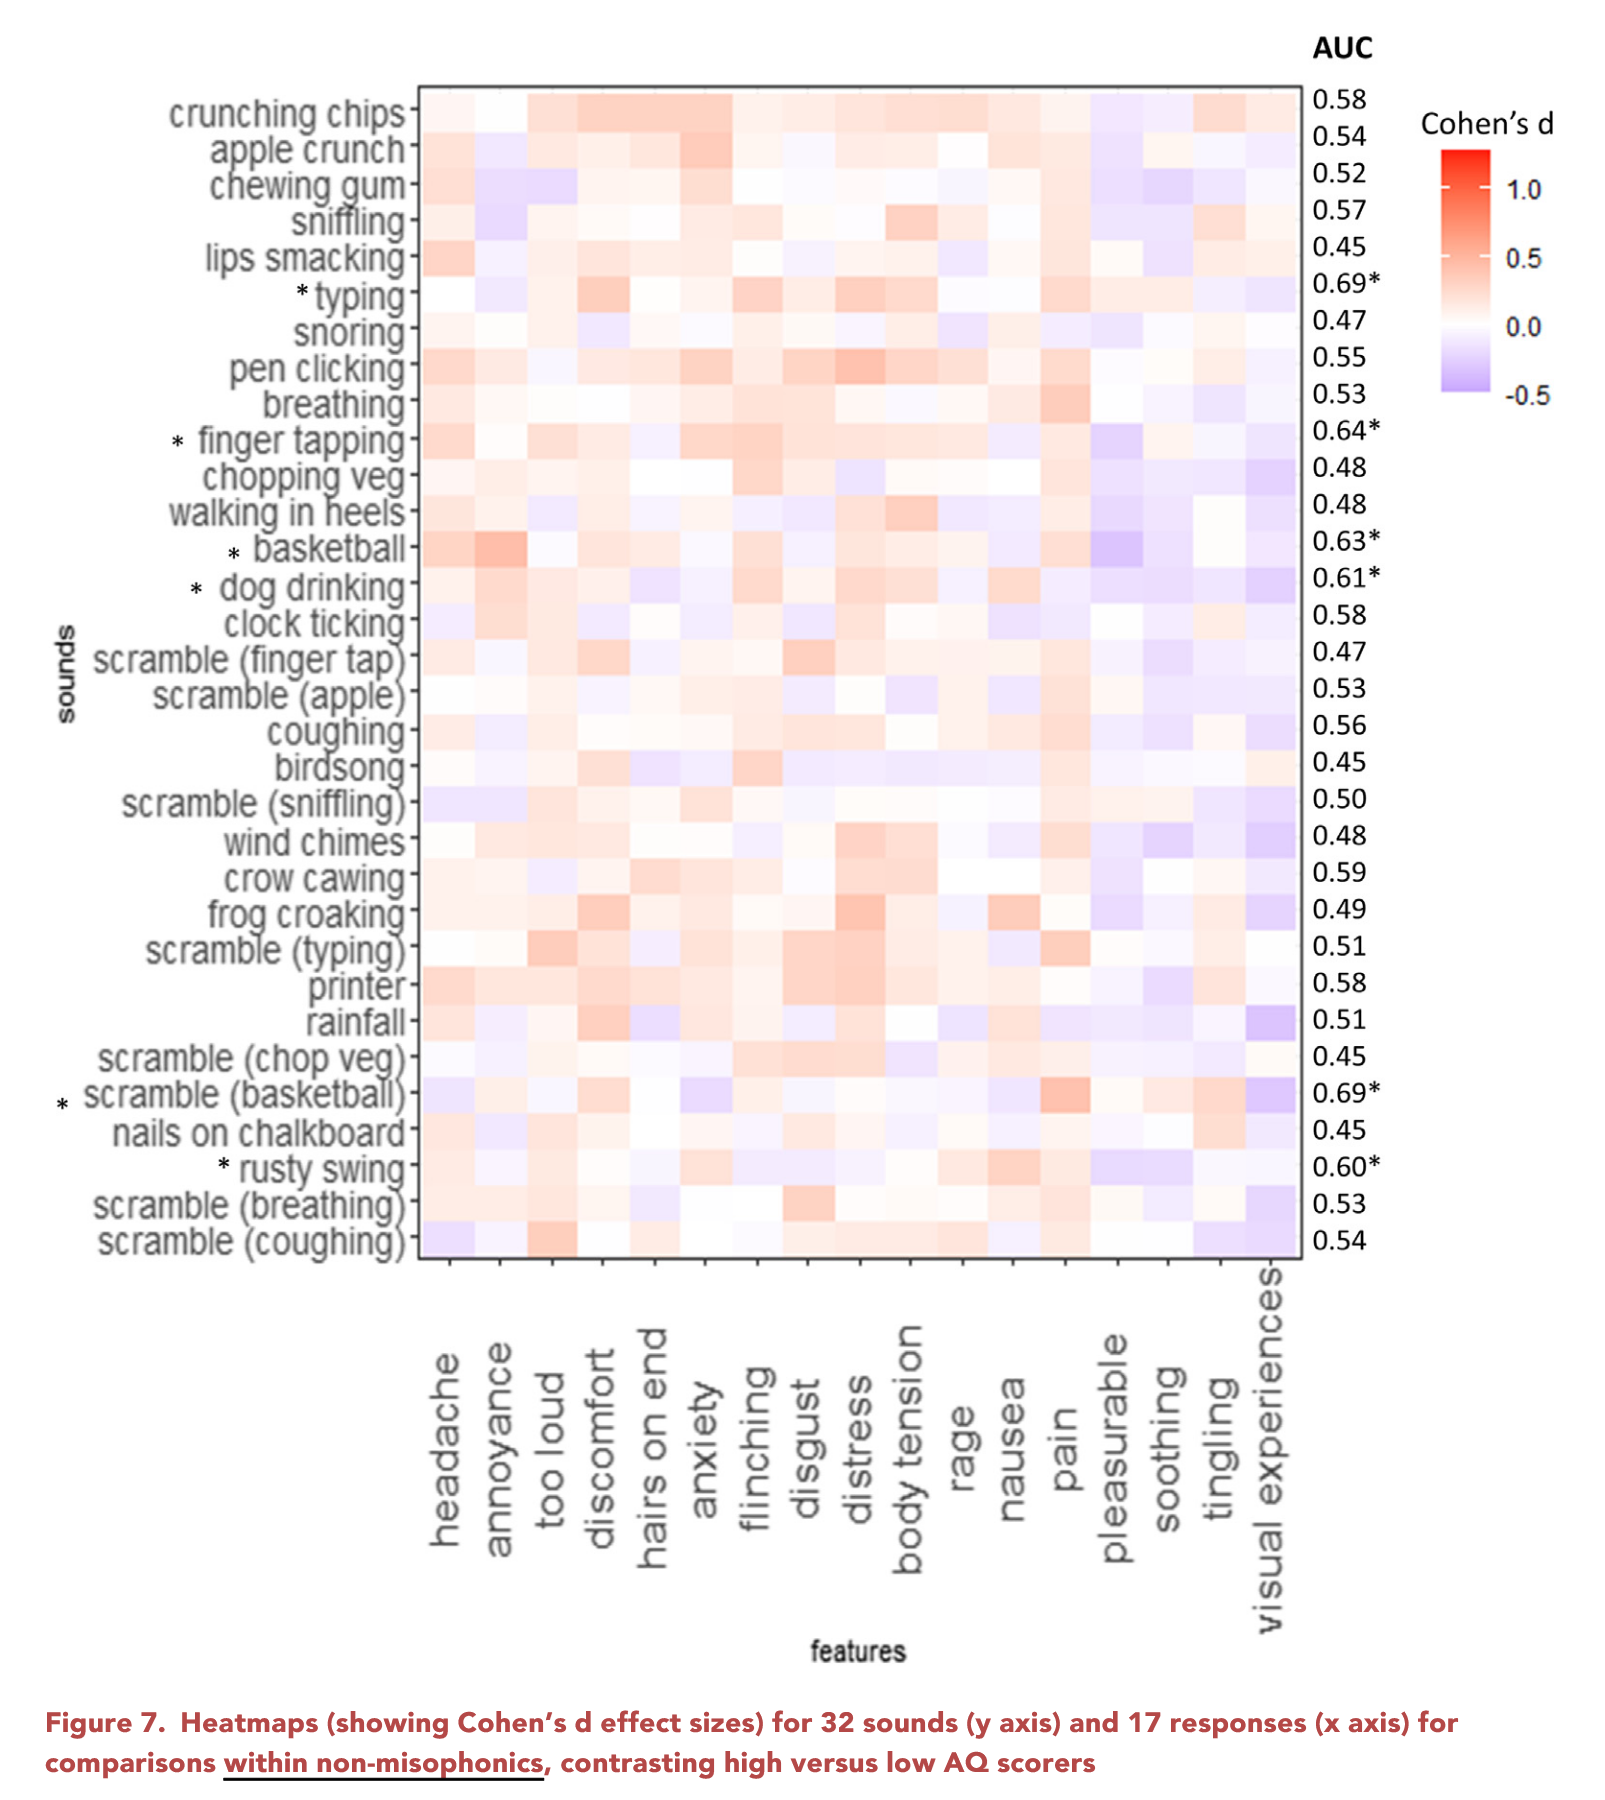
- Autism-related profiles emphasize repetitive non-oral sounds
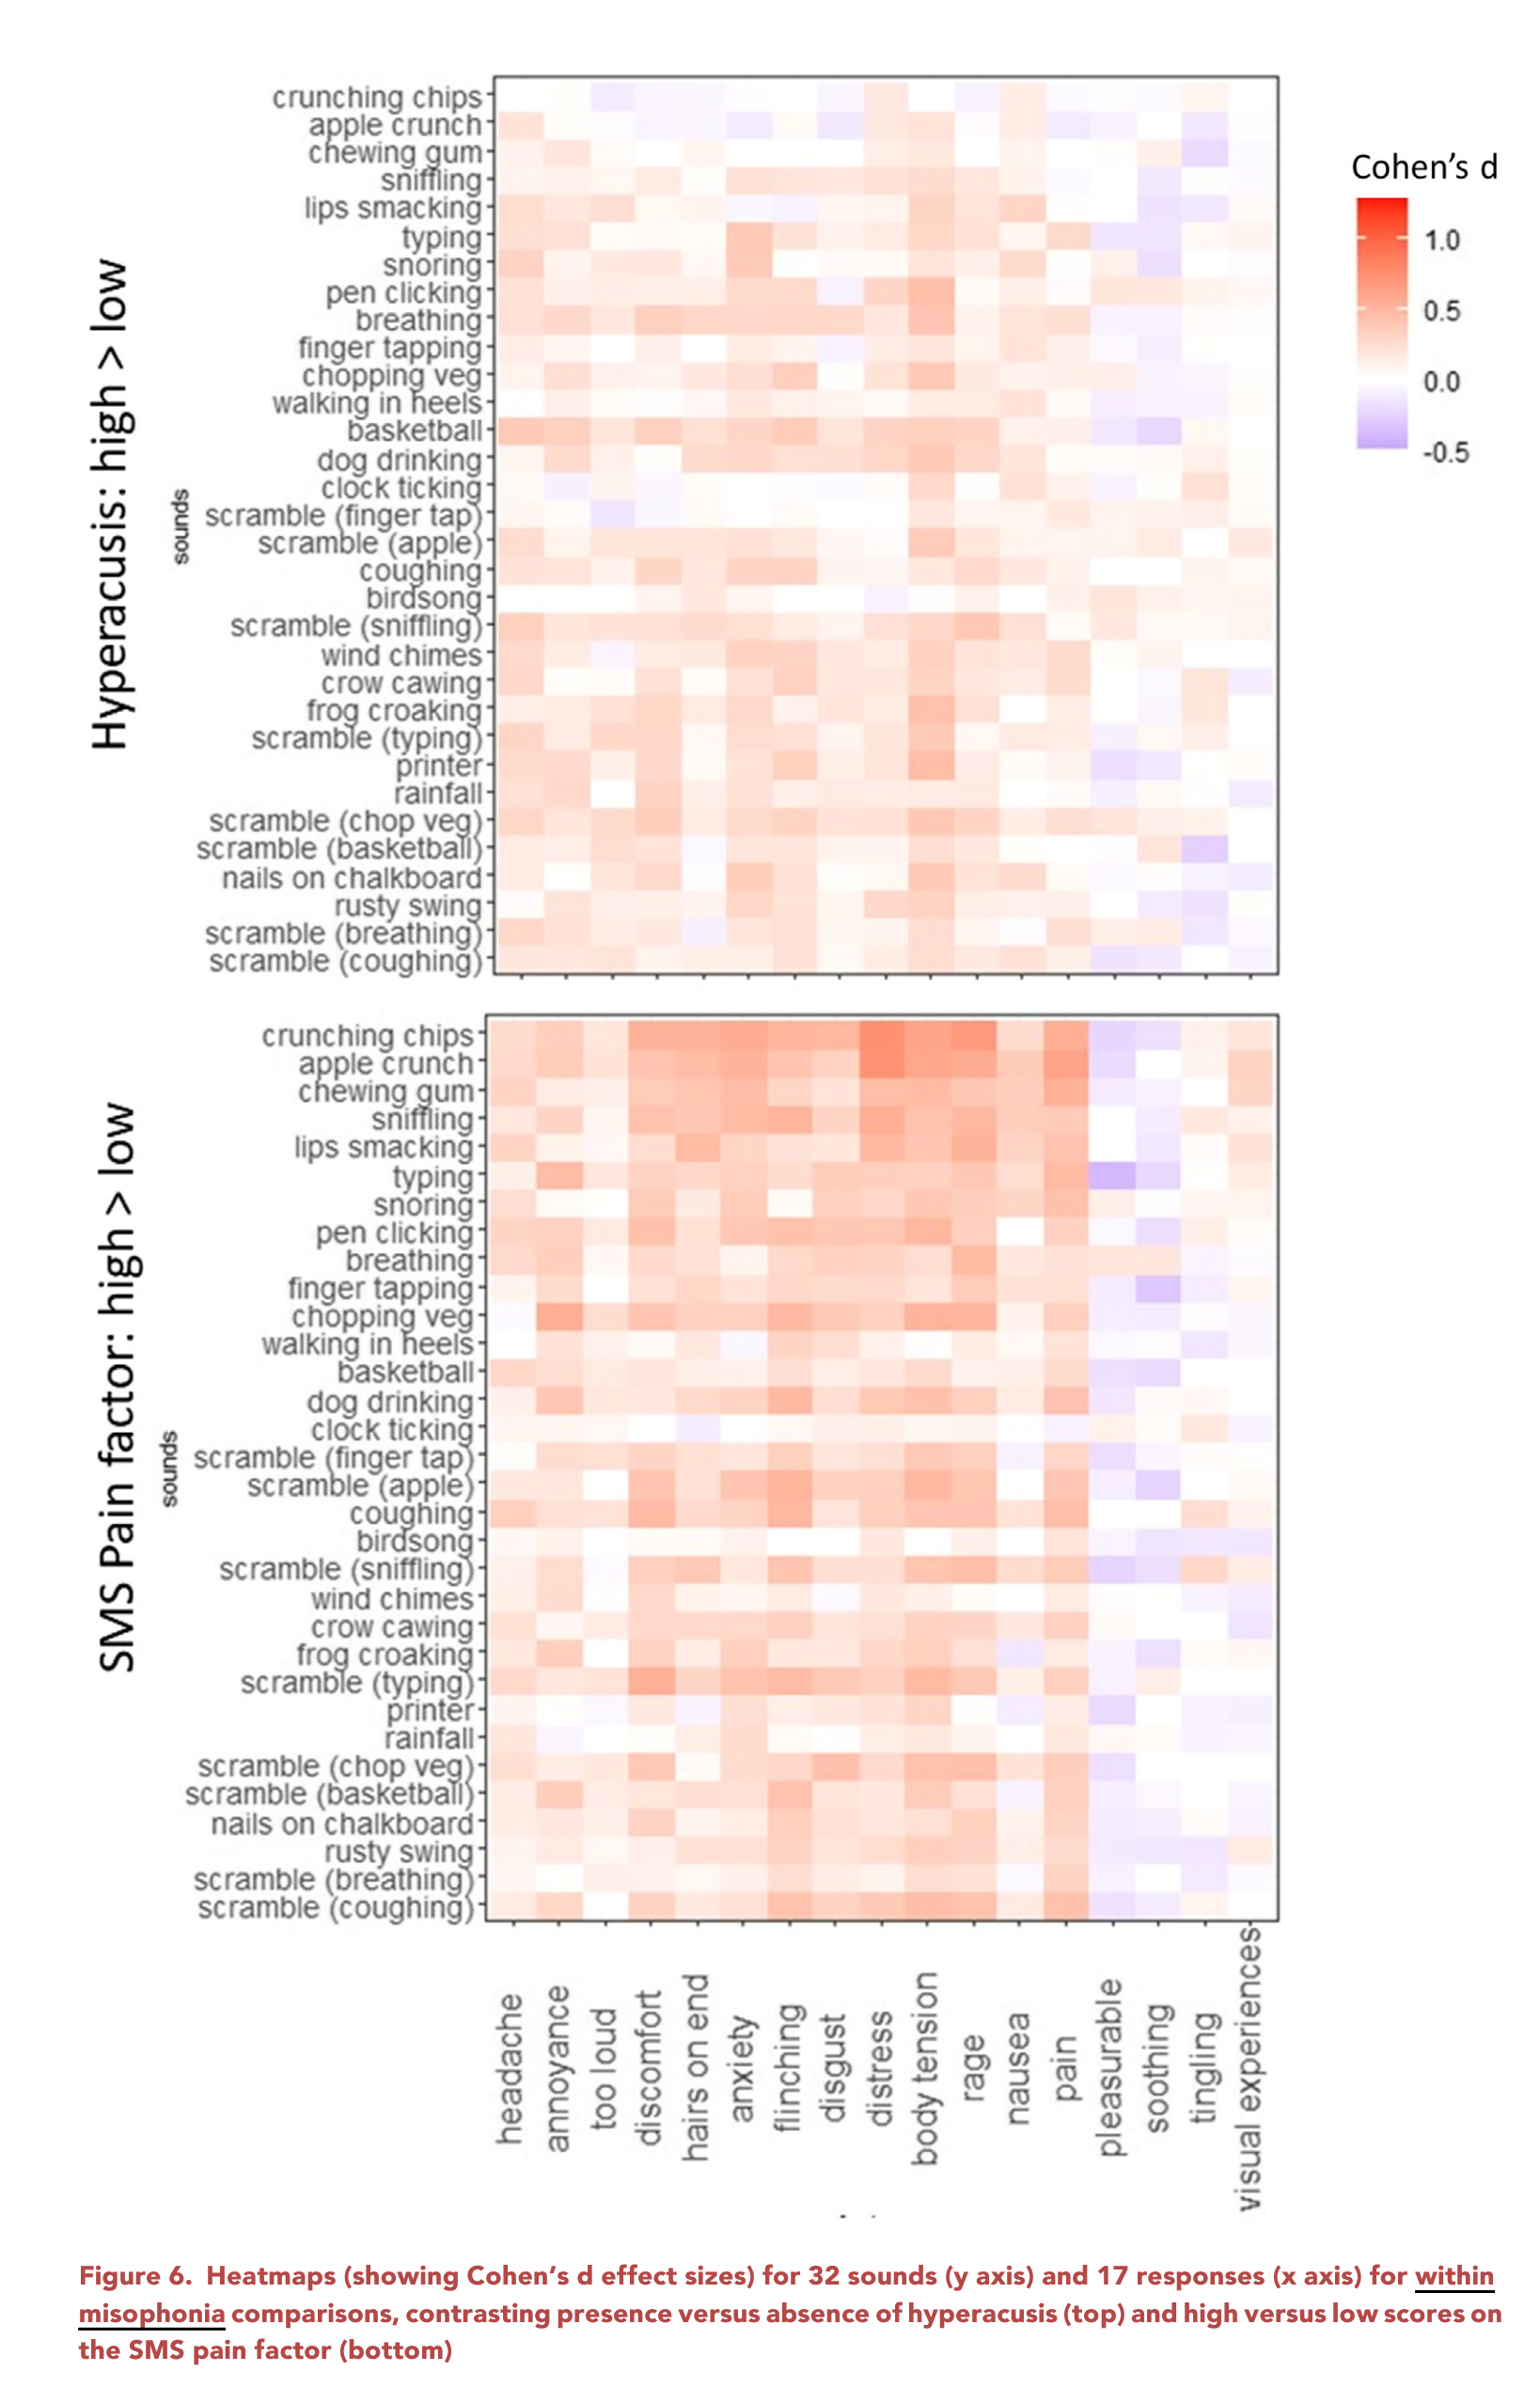
- Hyperacusis linked to loudness/pain responses rather than anger/disgust
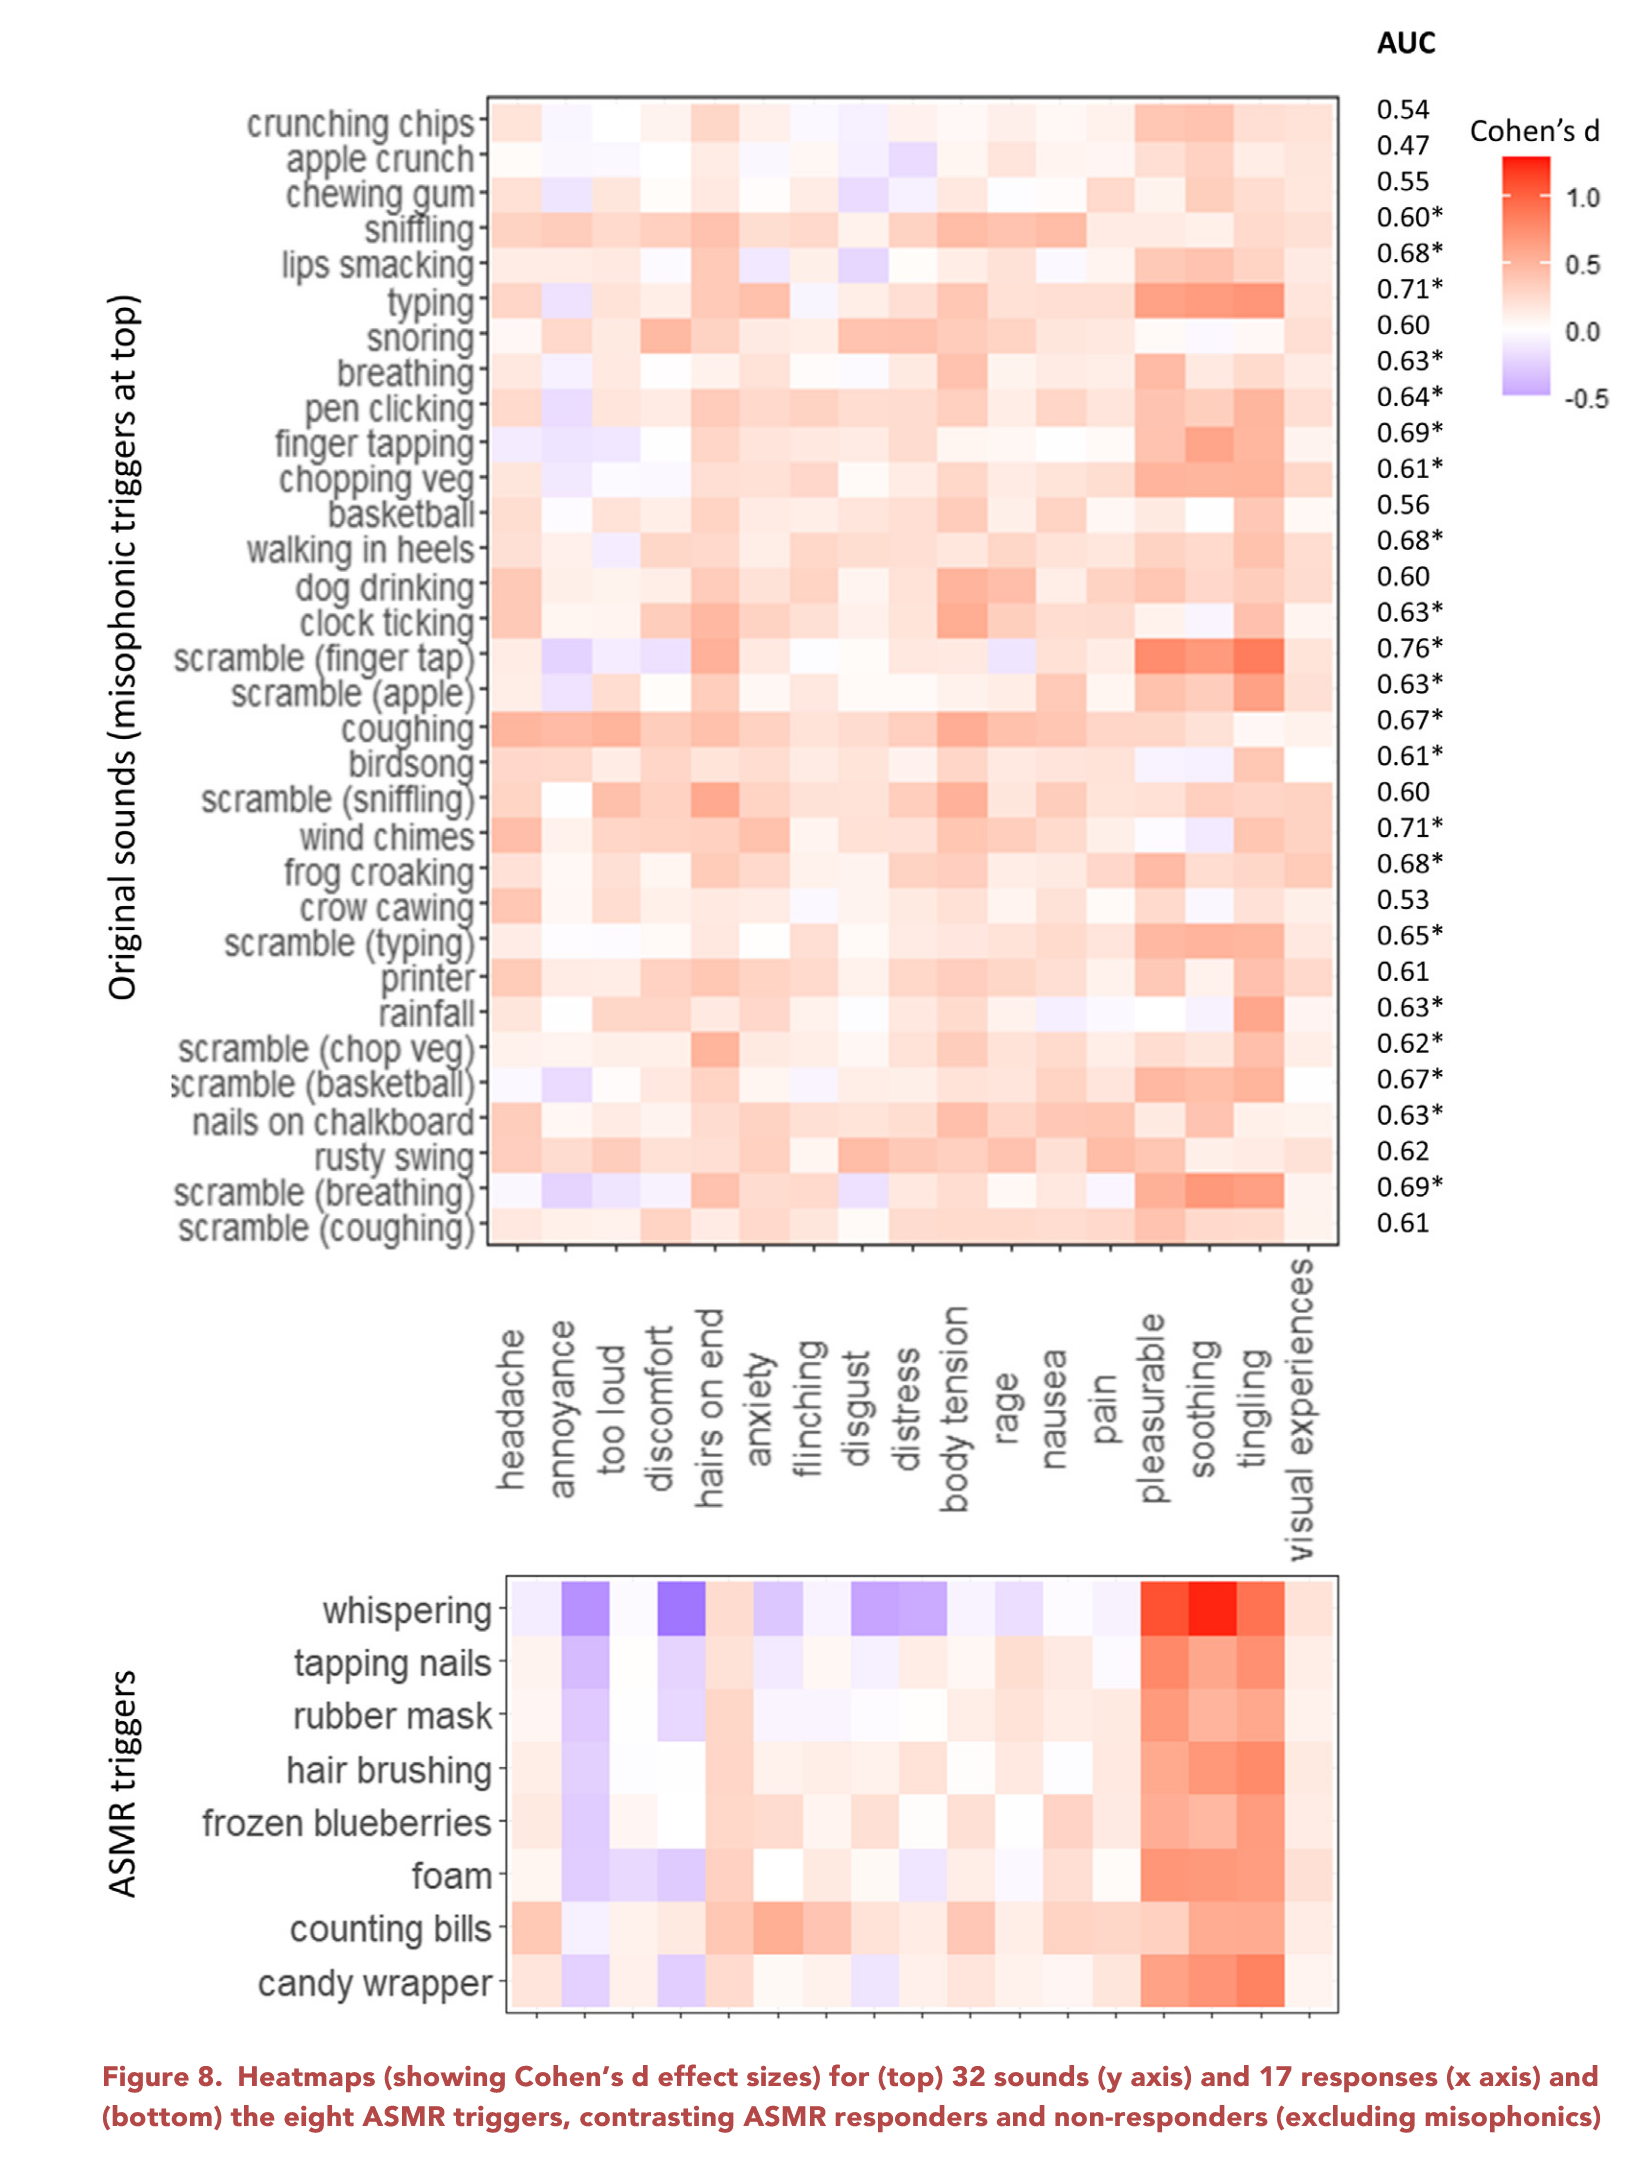
- ASMR profiles reflect increased soothing/pleasurable responses, especially to scrambled and whispering sounds
Visual Experience Ratings:
- Lower in misophonics, especially for unrecognizable sounds, suggesting reduced visual imagery
Implications:
- Misophonia may arise from general sensory hypersensitivity, shaped by developmental/environmental factors
- Individualized treatment may be required based on unique sound-response profile
zettlekasten
2023 idea of a phenomenological cartography of Misophonia
2023 study shows that Misophonics can be identified by sound response profiles
2023 paper supports diminished role of psychoacoustic features in Misophonia