Properties (17)
- purpleRed
- (Clonan et al., 2025)
•
Identifying the acoustic fingerprints of trigger sounds and predicting discomfort for misophonia
Status:: #status/reviewed
Metadata
- Item Type: #journalArticle
- Authors:: Alex C. Clonan, Ian H. Stevenson, Monty A. Escabí,
- Date:
- Date Added: 1764877338000
- URL: https://linkinghub.elsevier.com/retrieve/pii/S0378595525002965
- DOI: 10.1016/j.heares.2025.109478
- Cite Key: clonanIdentifyingAcousticFingerprints2025
- Topics: [object Object]
- Tags:: #Auditory, #Auditory-model, #diagnostics, #FOAMS, #Generalized-perceptual-regression, #Misophonia, #reviewed, #tolerance-prediction, #trigger-detection,
- PDF Attachments
Abstract
| Background/Purpose | Background- • Misophonia evokes severe anxiety, anger, or disgust to commonly encountered everyday sounds. • Classified as a disorder of reduced tolerance and altered emotional perception of sounds. • Conflicting evidence on auditory cortex involvement; altered functional communication observed between auditory cortex and saliency/emotion regions (insula, amygdala, prefrontal cortex, hippocampus). • Auditory midbrain sensitivity has been correlated with tolerance to background noise. • Trigger sounds vary widely person-to-person; no consensus on precise acoustic features driving the disorder. • Existing diagnostics rely on categorical sound preferences and listening profiles. • No current diagnostic tool pinpoints specific acoustic properties triggering events or predicts aversion to novel sounds. • Substantial heterogeneity exists in specific triggering sounds across people, even within broadly aversive categories. Purpose- • Propose a bottom-up auditory modeling approach to characterize and diagnose misophonia preferences and predict tolerance ratings. • Determine whether bottom-up statistical features from periphery and midbrain explain sound aversion. • Identify specific spectrotemporal features underlying aversion for individual listeners. • Demonstrate extrapolation to untested sounds and personalized trigger detection in continuous audio. |
| Participants/samples | • FOAMS corpus; 21 listeners total. • Modeled n = 19; 2 excluded for reporting no aversion. • n = 4 classified misophonic; n = 15 non-misophonic. • Participants 1, 3, 5, 6 exceeded S-Five threshold; participants 5, 6 exceeded DMQ impairment threshold. |
| Measures | • Duke Misophonia Questionnaire (DMQ); summed scores include symptoms, coping, impairment, belief factors. • S-Five questionnaire; summed scores include internalizing appraisals, externalizing appraisals, sense of emotional threat, outbursts, impact factors. • Tolerance/discomfort ratings (0–5; 0 = benign, 5 = aversive). |
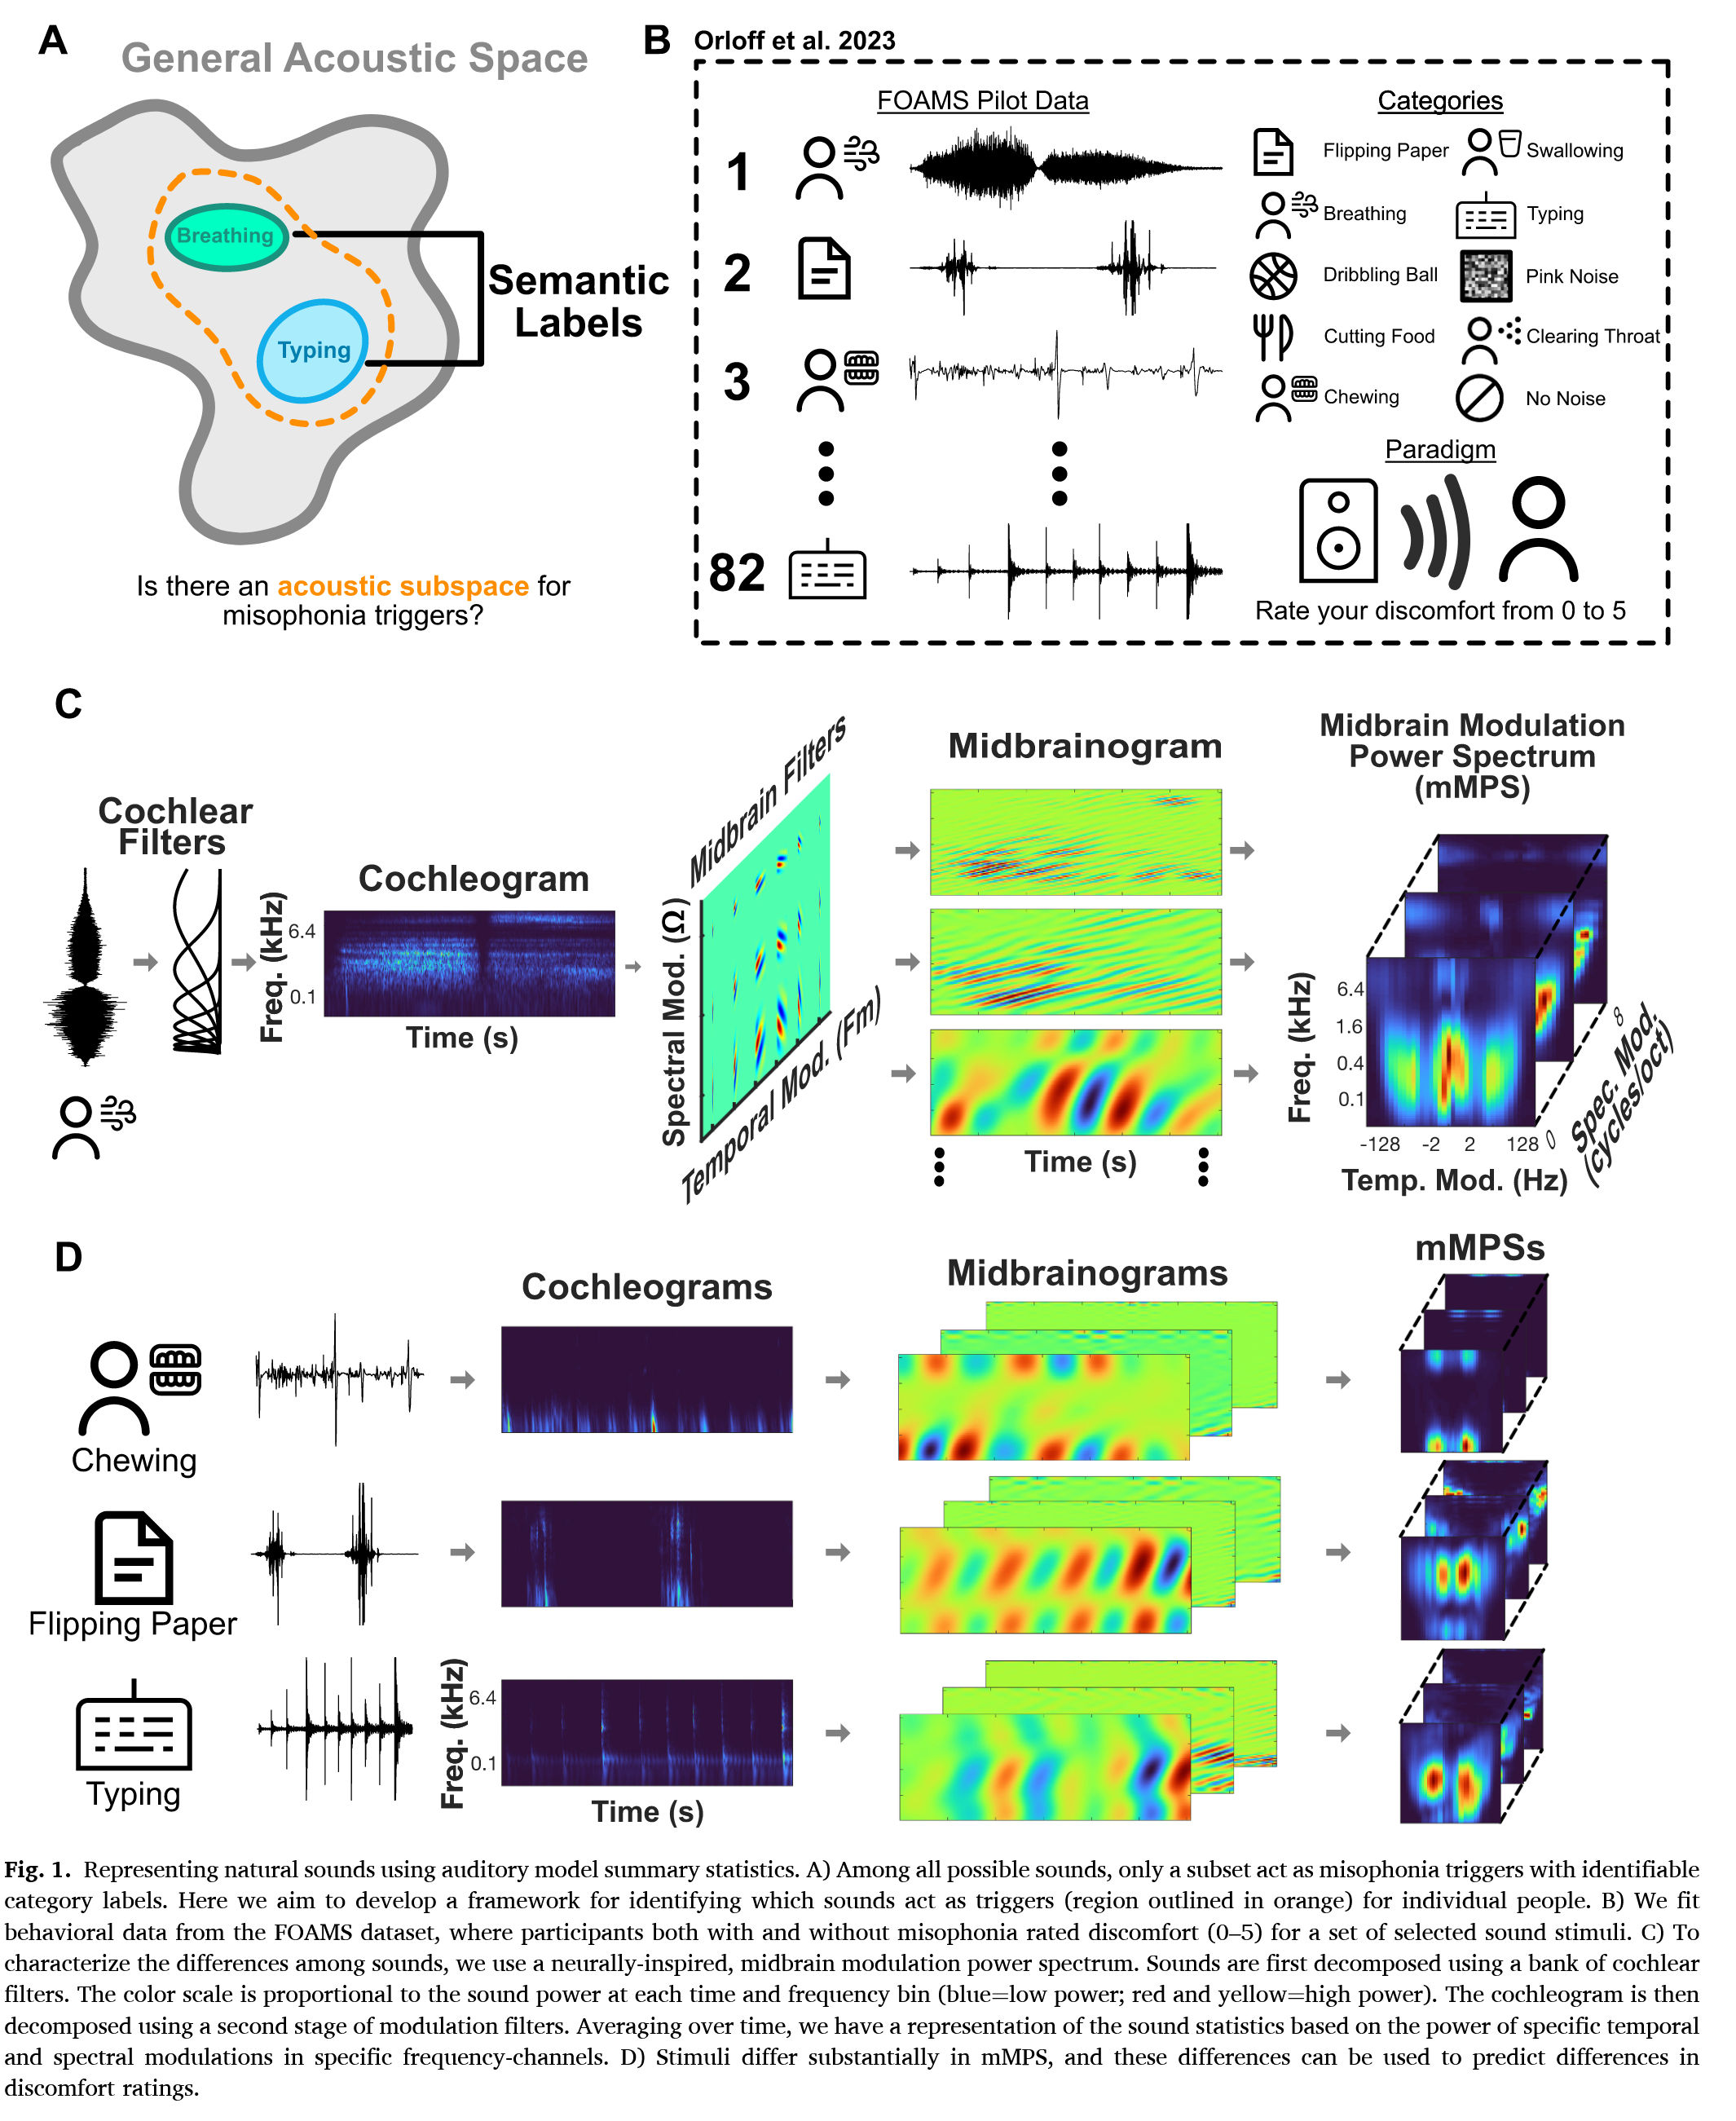
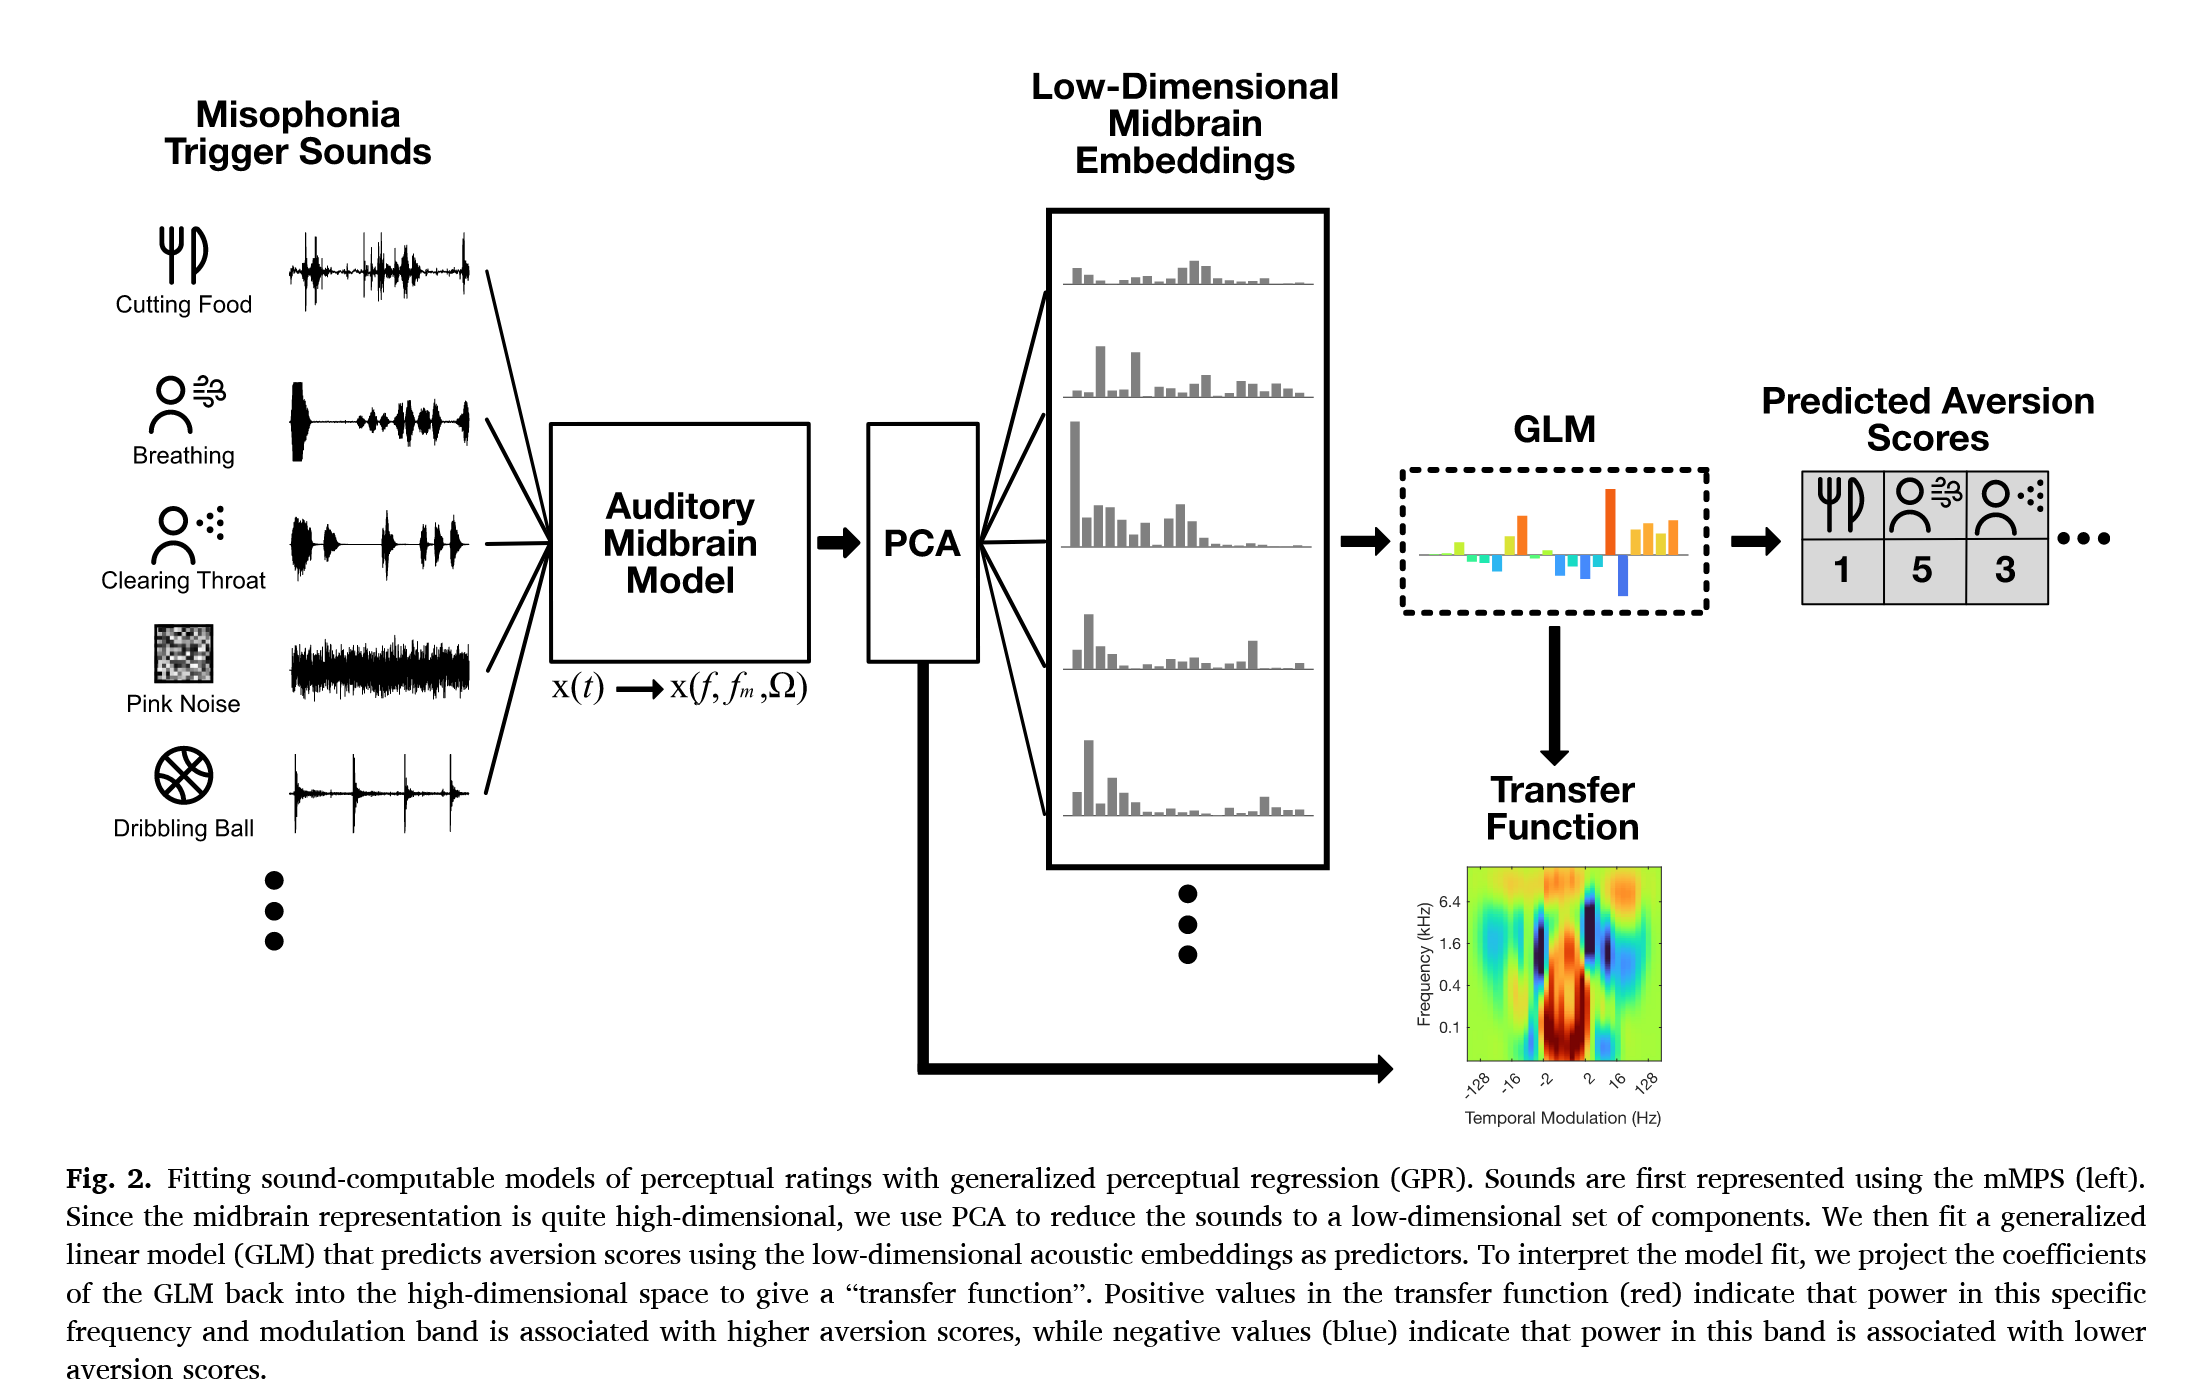
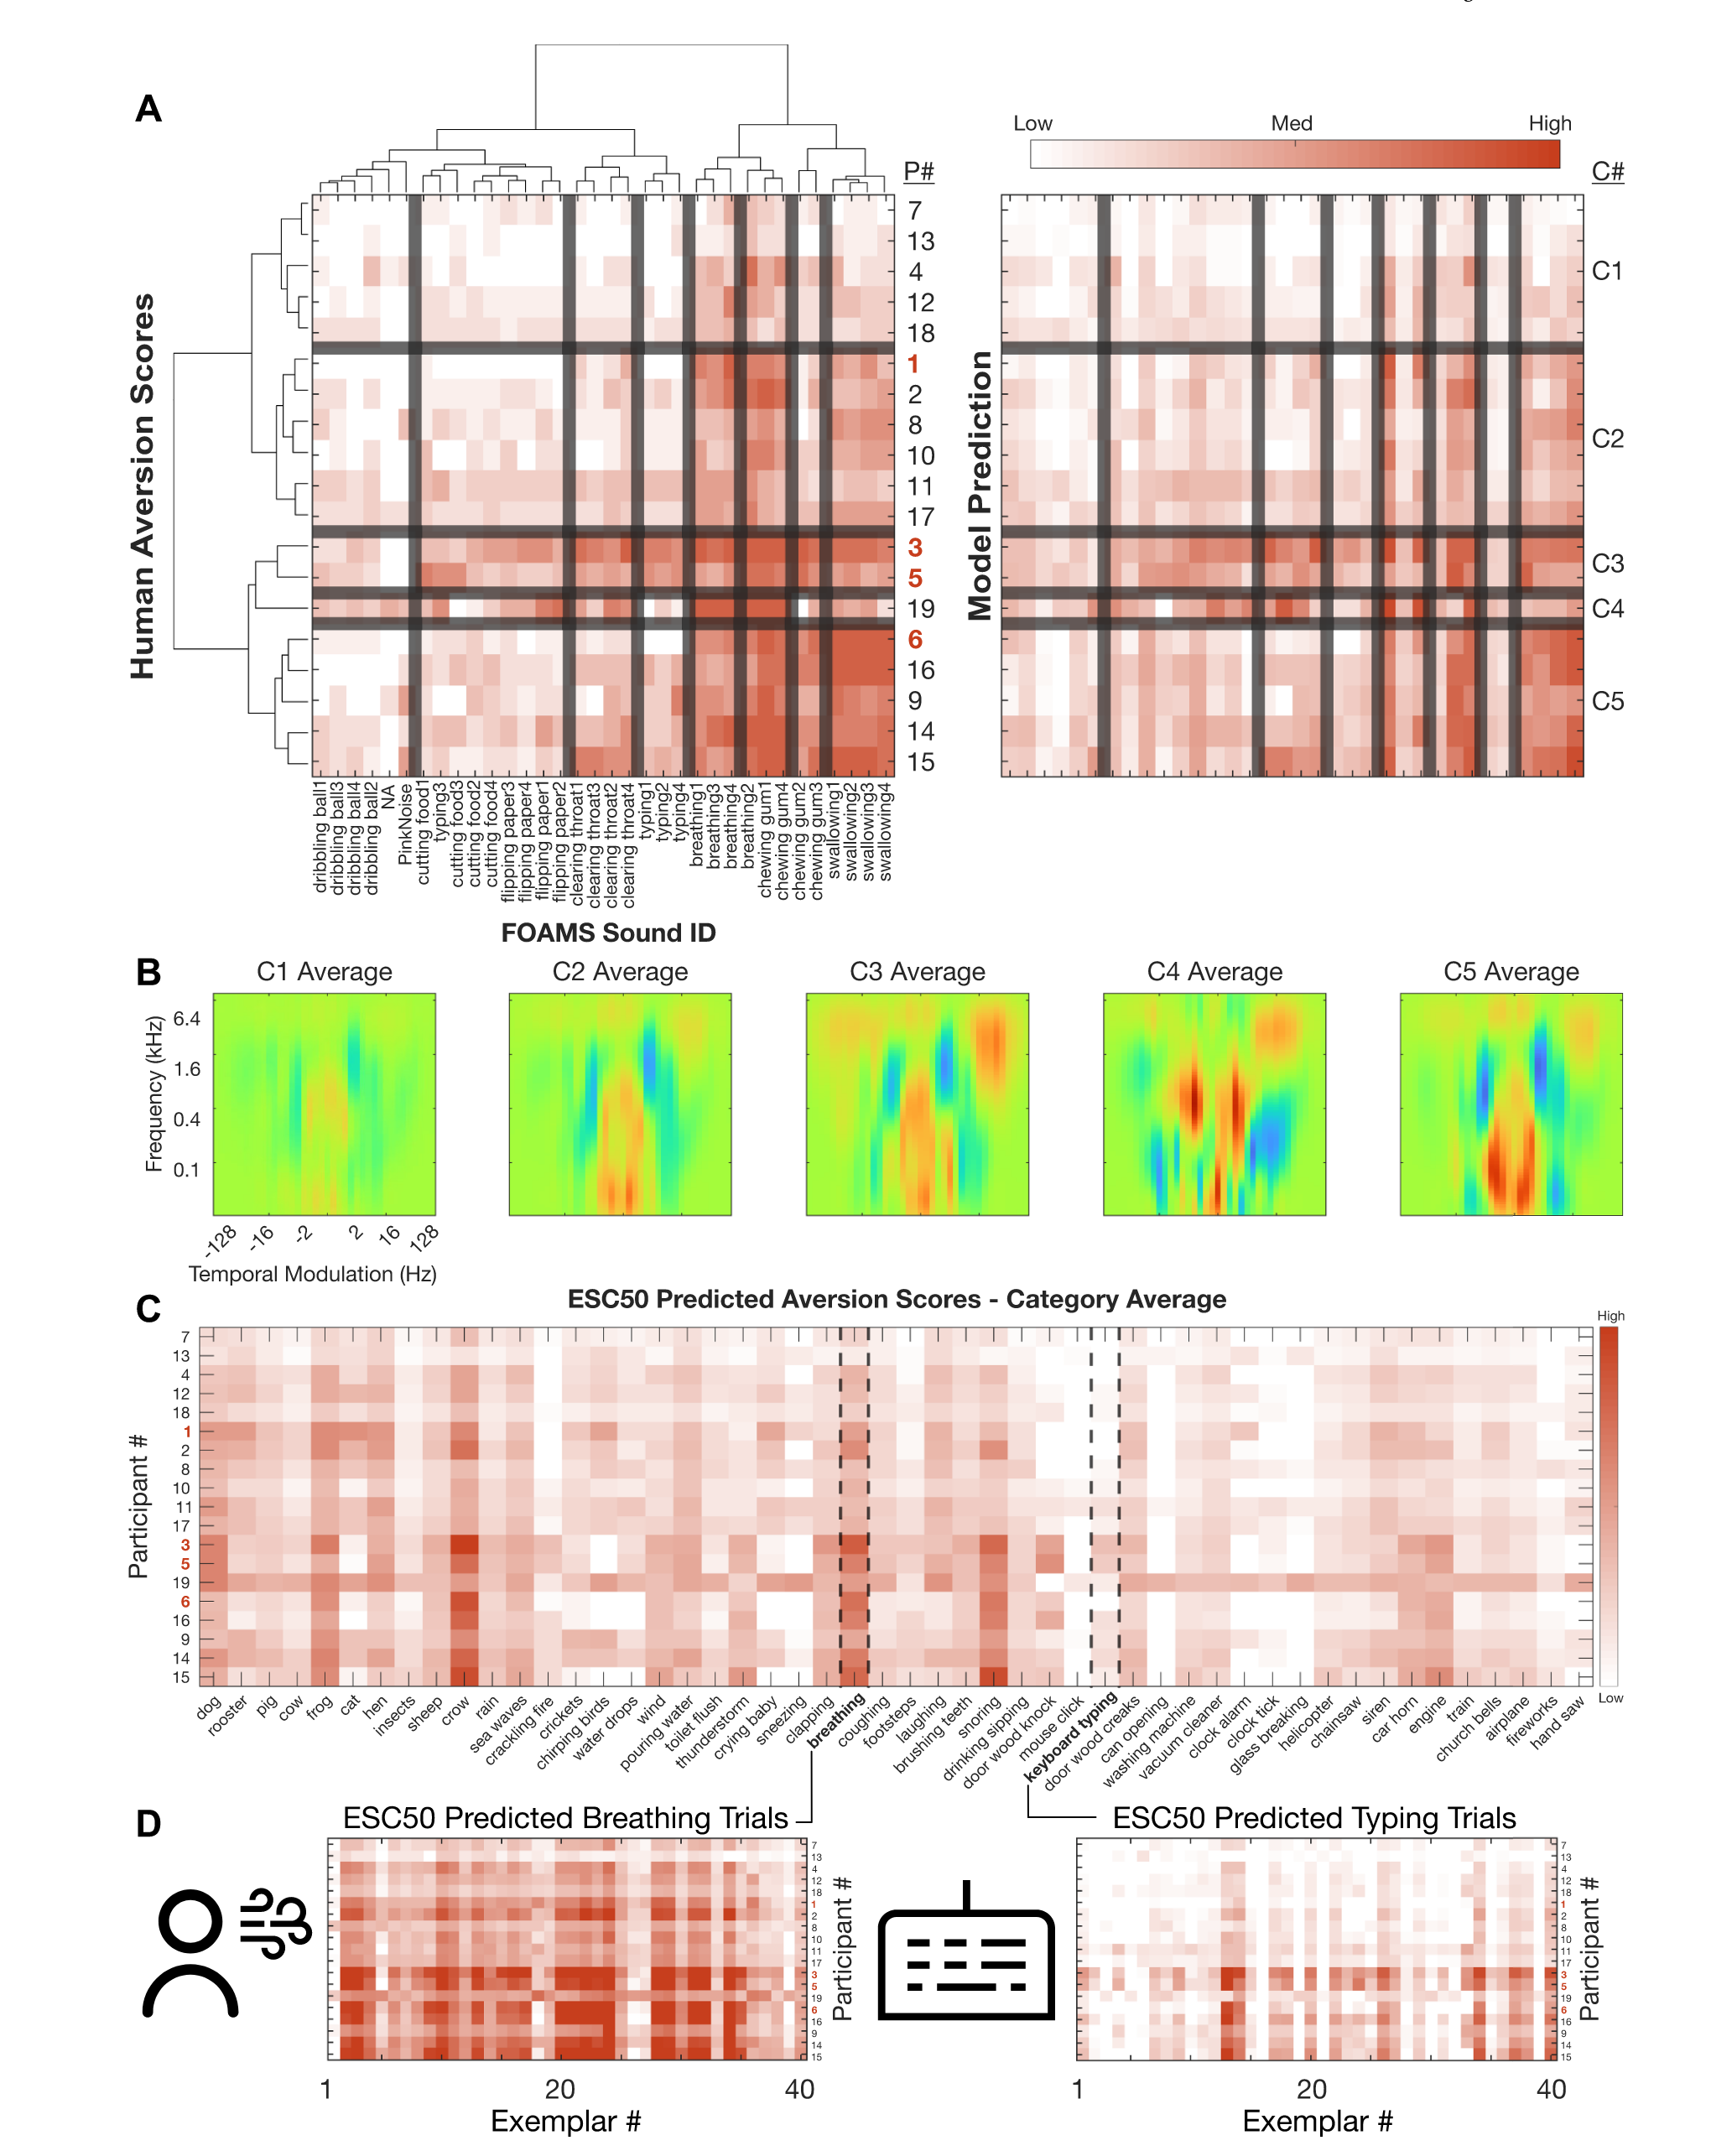
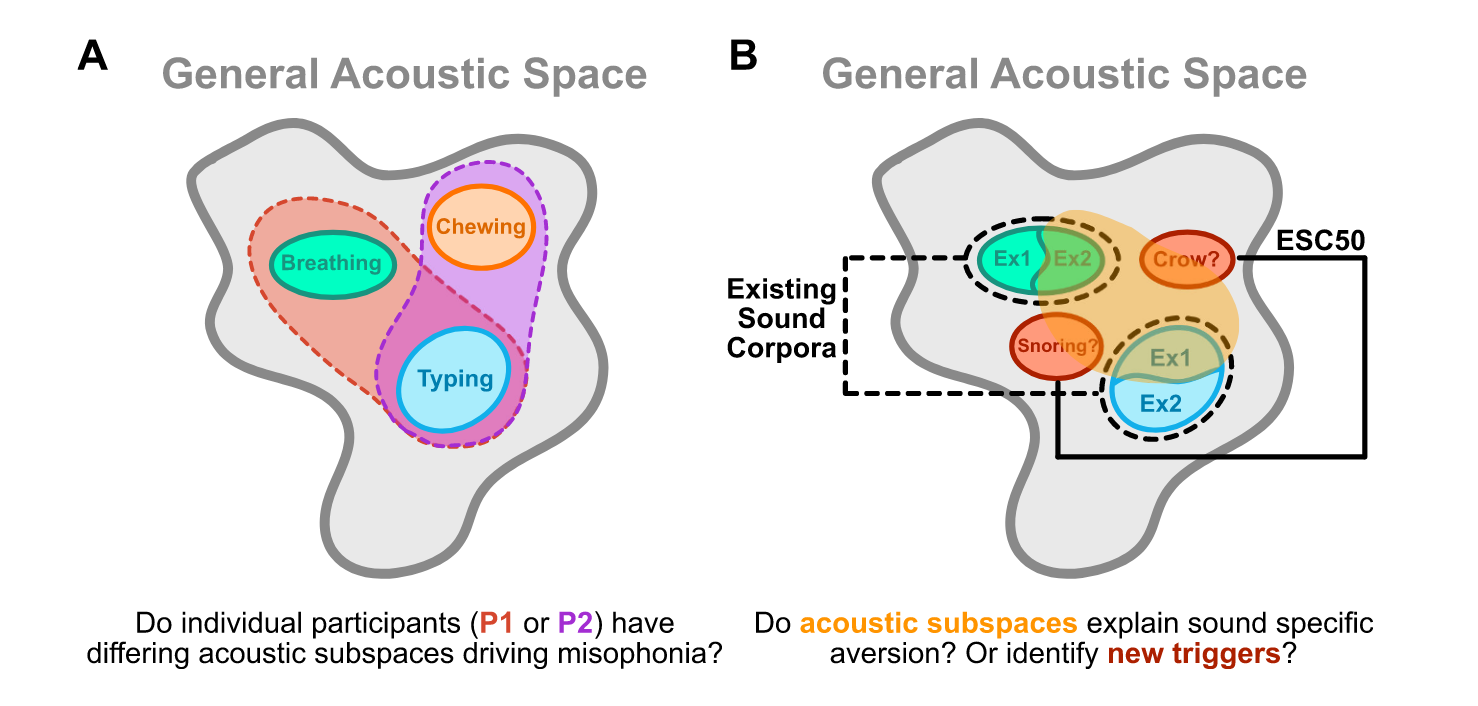
| Procedures | • Hierarchical Framework: The study utilizes a biologically inspired model mimicking the cochlea and auditory midbrain, decomposing sounds into spectrotemporal modulation components to create a midbrain-modulation power spectrum (mMPS). (page 2) • FOAMS: 82 potential trigger sounds; participants rate discomfort 0–5; 4 sounds per category. • Cochlear stage: gamma-tone filterbank with equivalent rectangular bandwidths (82 filters, 20–20k Hz, 50% overlap), hair-cell rectification, 750 Hz lowpass (auditory nerve), nonlinear output compression; produces cochleogram. • Midbrain stage: bank of log-spaced spectrotemporal modulation filters (1-octave bandwidths); temporal modulation ±0.5 to ±512 Hz, spectral modulation 0.25 to 8 cycles/oct; produces midbrainogram. • mMPS: time-averaged power across midbrain outputs; 82 frequencies × 38 temporal modulations × 8 spectral modulations. • GPR: PCA dimensionality reduction (20 components for FOAMS, 40 for ESC50), GLM fit by maximizing log-likelihood, 8-fold cross validation; weights projected back to mMPS space to form pTFs. • Diagnostic relation: GPR intercept and gain compared against summed DMQ and S-Five scores. • Convolutional trigger detection: 2-second window, 1-second overlap; time-varying mMPS, PCA, GLM weights applied. • Detection tested on a 10-minute segment from the movie 'Up' with 18 inserted FOAMS triggers (9 generally aversive, 9 conditionally aversive) at 0 dB SNR. • Hierarchical clustering of raw tolerance scores (Ward's minimum variance, MATLAB 'linkage'). • ESC50 extrapolation; t-SNE on mMPS features; YAMNet for category classification. |
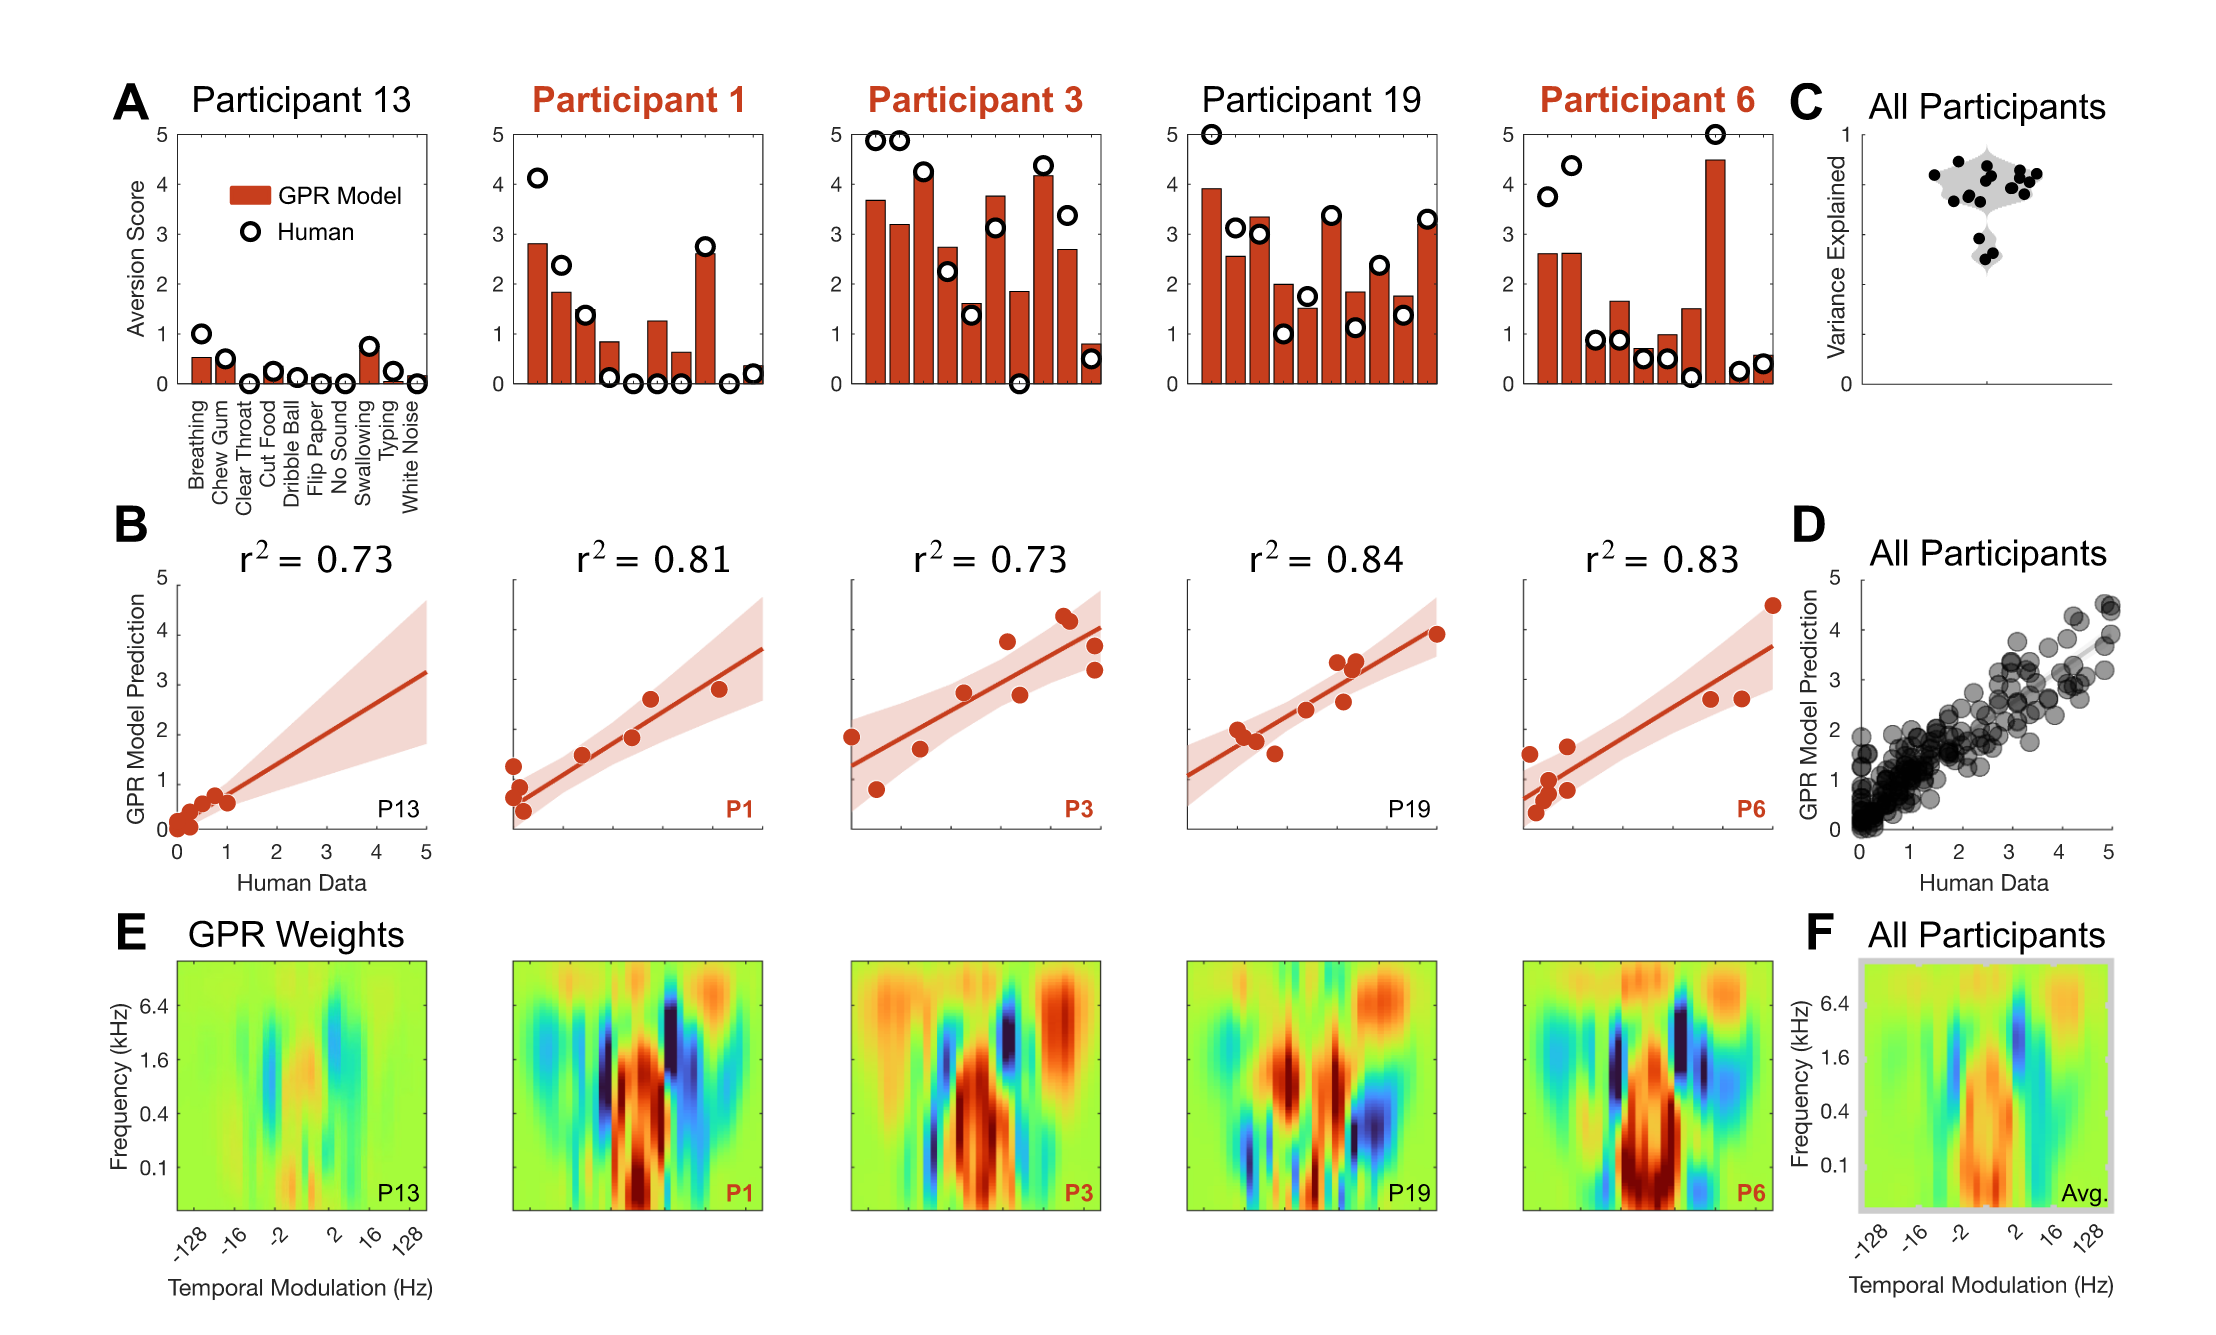
| Results | Model prediction • mMPS summary statistics predict individual tolerance ratings across acoustic categories. • Participants show markedly different average tolerance across categories. • GPR captures distinct aversion profiles (general low aversion; sharp aversion to bodily/respiratory sounds; aversion to flipping paper and typing). • Model predicts perceptual variance well above a random worst-case baseline. Transfer functions • Each participant has a unique pTF morphology. • A common low-frequency, slow temporal-modulation component drives aversive tolerance across most listeners. • Low-aversion participant has a weaker (low-gain) transfer function. • Faster temporal modulations and high frequencies drive aversion in the paper/typing-sensitive participant. Diagnostic correlation • GPR intercept positively associated with summed DMQ and S-Five scores. • GPR gain positively associated with summed DMQ and S-Five scores. • Intercept and gain associated with upper-quartile FOAMS aversion scores. • Intercept and gain associated with each other. Clustering • Hierarchical clustering of raw scores reveals distinct participant clusters. • Clusters differ in sensitivity (general low aversion; high aversion across most categories; aversion specific to breathing and oral sounds). • Cluster-average transfer functions show distinct spectrotemporal patterns matching individual pTFs. Extrapolation • GPR predicts tolerance for out-of-sample ESC50 sounds. • Predictions for shared categories (breathing) consistent across datasets. • Novel categories (snoring, crow) predicted aversive for some clusters. • Within-category heterogeneity in predicted aversion (some breathing exemplars not aversive; some typing exemplars aversive). • Out-of-distribution predictions maintain personalized preferences. Acoustic space • t-SNE shows some categories cluster acoustically (machine sounds, vocalizations) while others spread (bodily sounds). • FOAMS sparsely samples the acoustic space relative to ESC50. • Within-category diversity more evident in ESC50 than FOAMS. • Projected predictions show participant differences in overall severity and aversive regions. Trigger detection • Convolutional detection identifies injected generally-aversive triggers across participants and time. • Conditionally-aversive sounds show participant-specific rather than reliable activation. • Some unplaced audio segments are predicted aversive. • Mixture predictions correlate with clean aversion responses. • YAMNet category timing largely uncorrelated with predicted tolerance; high-discomfort regions mostly classified "ambiguous". |
| Discussion/Limits | Conclusion- • Time-averaged summary statistics from a biological auditory model suffice to predict sound tolerance trends across participants with distinct aversion patterns. • Acoustic features, spectrotemporal modulations in particular, can characterize individualized patterns of aversion without explicit categorization. • Individual modulation cues have small impact, but co-occurring cues build into ensembles with high discomfort. • A feature-based model agnostic to semantics can identify misophonic etiologies and has diagnostic potential. • Use of a midbrain model does not causally link findings to subcortical or midbrain computations. • Unlike prior group-average approaches, GPR generates individualized models of each listener's profile. • pTF parameters correlate with established diagnostic scores, suggesting diagnostic use. • The pTF can be conceptualized as a multi-dimensional psychometric function for natural sounds. • Separating sound representation from behavioral prediction makes GPR highly interpretable. • The sound-computable approach generalizes to novel triggers and operates in continuous sound mixtures. • pTFs account only for acoustic contributions; visual, emotional, and attentional factors also contribute. • Authors raise, as an open question, whether misophonic perception is driven by conditioned ensembles of acoustic features associated with emotional context. |
| Limitations:: | • Small participant sample and limited training sounds in FOAMS. • FOAMS samples only a small subspace of possible natural sounds. • Accuracy of pTFs and out-of-set predictions requires verification. • Midbrain model use does not establish a causal subcortical link. • Low-dimensional visualizations may not fully capture high-dimensional categorization. |
| Future Directions:: | • Perceptual studies using synthetic sounds and more acoustically diverse sound sets. • Larger populations to identify population-level transfer function differences and set diagnostic standards. • Design optimized misophonia corpora balanced with misophonic and non-misophonic sounds. • Extend GPR with electrophysiological, behavioral, and multisensory predictors (hybrid multimodal model). • Combine GPR with symptom-dimension mapping via MIMO regression. • Real-time interventions that identify and attenuate triggers. |
| Relevance:: | • a very interesting paper for methods around modeling the acoustics of Misophonia and using these models to detect triggers in pre-existing audio. • study used a statistical method of modeling acoustic features to show the feasibility of using such models to predict misophonia aversiveness to sounds, both tested and untested. • paper has an interesting interaction with a previous non Misophonia Kumar paper and the (Andermane et al., 2023) paper • study introduces a the concept of individualized transfer functions, a measure of the spectrotemporal modulations that contribute to individual sound aversion. the authors claim this can be computed to give perceptual ratings fit from or predicted for any sound once calculated. |
Notes
key terms and concepts
-
misophonia – "hatred of sounds"; disorder involving reduced tolerance and altered emotional perception of sounds; characterized by heightened emotional, physiological, and behavioral sensitivity to specific sounds ("triggers").
-
mMPS (midbrain modulation power spectrum) – time-averaged summary statistic representing each sound as a power distribution across frequency, temporal modulation, and spectral modulation dimensions.
-
pTF (perceptual transfer function) – model weights projected back into the original midbrain model space; interpretable mapping between the sound representation and a participant's tolerance ratings. (page 8)
-
cochleogram – representation of the sound in time and frequency produced by the cochlear filterbank.
-
midbrainogram – multi-dimensional model output capturing modulation-based decomposition; series of subband modulation outputs each at a distinct spectrotemporal resolution.
-
summary statistics – time-averaged outputs of the midbrain model describing the statistical characteristics of a sound.
-
FOAMS – Free Open-Access Misophonia Stimuli; sound corpus with accompanying tolerance ratings.
-
ESC50 – Environmental Sound Classification corpus; 2000 natural sounds, 50 categories, 40 exemplars each.
-
DMQ – Duke Misophonia Questionnaire.
-
S-Five – misophonia psychometric questionnaire.
-
GPR intercept – constant term corresponding to the listener's average predicted aversion score.
-
GPR gain – vector norm of the model weights.
-
sound-computable – property of being applicable to any arbitrary sound to predict perceptual ratings.
-
t-SNE – t-distributed stochastic neighbor embedding; maps high-dimensional features to a 2D space preserving relative Euclidean distance.
-
Generalized Perceptual Regression (GPR) - a modeling framework that maps stimulus features to perceptual preferences (pdf) (page 6)
my engagement notes
my questions
my comments
- so the big idea here is not that miso is pure bottom up, but a mix of bottom up and top down (page 2)
Bookmarks
-
bookmark describing Generalized Perceptual Regression (GPR) (page 3)
-
bookmark for fitting GPR using 8 fold cross validation (page 3)
-
Convolutional trigger detection (page 4)
-
Perceptual and acoustic clustering of FOAMS sounds and extrapolation to a broader acoustic space (page 4)
-
Auditory model summary statistics predict perceptual tolerance ratings to natural sounds (page 4)
-
perceptual transfer functions (page 8)
-
Acoustic and perceptual diversity of trigger sounds (page 8)
-
Using perceptual transfer functions for convolutional trigger detection in pre-recorded media (page 11)
-
Using sound-computable summary statistics to predict cohorts of misophonic perception (page 13)
-
contrasting a previous ( non miso) kumar paper on sound dicomposition (page 14)
-
the GRP framework applied to Misophonia (page 14)
reading notes
Misc notes
contextual statement
In a 2025 study, Clonan attempted to predict misophonia discomfort ratings and identify the acoustic features driving sound aversion by deriving auditory midbrain summary statistics (mMPS) from FOAMS sounds and fitting individualized generalized perceptual regression models for 19 listeners assessed with the DMQ and S-Five.
Generalized Perceptual Regression (GPR)
(pdf)
- Generalized Perceptual Regression (GPR) - a modeling framework that maps stimulus features to perceptual preferences (pdf)
- as statistical method for mapping sound features to individual behavioral performance, used in the authors previous works to characterizes speech in noise behavior and finding it predictive of single trial speech recognition across many different kinds of background sounds
- was used in this study to predict individual subject perceptual tolerance and identify individual sound features underlying sound aversion (pdf)
perceptual transfer functions
- account for individual listing profiles and allow interpretation and visualization in the midbrain acoustic space. (pdf)
- statistically measures that indicate frequency and modulation band sensitivities that heighten (red) or reduce ( blue) aversion scores (pdf)
- used to identify specific feature sensitives explaining individual tolerance trends (pdf)
- for example see fig 3A

contrasting with a previous (non miso) Kumar 2008 paper on sound decomposition (pdf) , and the use of method in Andermane 2023 showing null effects in a Misophonia study
the authors note and address two possible issues to the novelty of their findings
- in a 2008 study, demonstrated the usability of a similar auditory decomp approach to predict auditory unpleasantness from septotemporal features.
- method was used in (Andermane et al., 2023) but failed to find sig diffs in discomfort between Misophonics and controls
the authors address this with the following arguments
Kumar's use of partial least squares (PLS) vs the current methods use of dimensionality reduction (pdf)
previous studies used average responses, this study used individualized responses (pdf)
this studies unique extensions of previous finings (pdf)
Zettelkasten
Generalized perceptual Regression framework applied to Misophonia
predicting sound tolerance via acoustic summary statistics in Misophonia