Properties (17)
Id
a888be1e-5597-4154-a95d-bc2d7788509f
Year
2025
Abstract
The field of visual discomfort is fast growing, identifying parameters of visual stimuli that evoke discomfort, their effect on the visual system, and their heightened impact in clinical populations. In contrast, there is little work on auditory discomfort. First, we reviewed the current findings in the field of auditory discomfort and report a preliminary study investigating the effects of uncomfortable sounds on near infrared spectroscopy (NIRS) responses from auditory cortex. Nine participants listened to pure 1 kHz tones that were modulated by a 2 Hz or a 16 Hz sinusoidal wave that made the tone sound as though it wobbled. The oxyhaemoglobin response to the uncomfortable 16 Hz sound was larger and slower compared to the relatively more comfortable 2 Hz sound. This suggests cortical excitability to uncomfortable sounds, similar to the heightened response reported in the visual modality. Second, we assessed the relationship between visual and auditory sensitivity in a large sample (N = 669) of participants who completed the Pattern Glare Test (PGT), the Amsterdam Misophonia Scale, the Hyperacusis Questionnaire, and the Functional Hearing Questionnaire (FHQ). While all measures of auditory sensitivity were significantly correlated with the number of illusions seen in the PGT (.1 > rs < 0.3), the relationship with misophonia was significantly weaker than other comparisons. This highlights that while those who are visually sensitive are more likely to exhibit increased auditory sensitivity, the measures that focus on pain (PGT, hyperacusis, FHQ) may be dissociable from those that rely on emotive discomfort (misophonia). Together, this suggests similar mechanisms underlying auditory and visual discomfort.
Cssclasses
- purpleRed
Aliases
- (Haigh et al., 2025)
Import Date
11-10-2025
Template Version Notes
•corrected error in rendering the linked PDF in metadata section
• added the tag “noted” to the definition of comments to ignore ( like with the “in another note” tag. this is so that when making notes on chapters of a textbook, i can still export things for manual addition to the obsidian note without having to keep track of what has already been added ). Also moved the version notes to the yaml section
• this version added the bookmarks section to auto collect all bookmarks. it also dropped the template auto fill of the initial source field because we never got it working and just overwrote it manually anyway. this version also added logic to handle “in another note” tag. annotations marked with this are completely ignored. used when i have information covered in a bigger note, but still want to highlight that part in text for visual clarity (so as to avoid duplicates of the same information)
• running the import more then once will overwrite the file, so do not import again if you have made changes in obsidian that are not in the zotero article.
Initial Source
Misophonia MOC
Dv Authors
Sarah M. Haigh, Jasmine A. Haggerty, Aimee Delgado,
Dv Status
#status/reviewed
Dv Limitations
• Online PGT lacked control over viewing conditions and spatial frequency.
• Small sample size for NIRS reduces generalizability.
• Misophonia’s emotional component may explain weaker correlations with visual sensitivity.
Dv Future Directions
• Investigate cross-modal interventions (e.g., tinted lenses for vision, auditory therapies for sound).
• Explore whether cortical hyperexcitability generalizes across modalities and trait dimensions.
• Assess the role of early auditory processing (e.g., cochlear/brainstem) in discomfort.
• Include subclinical psychiatric traits as predictors or modulators of sensory discomfort.
• looking into what kinds of auditory stim are uncomfortable to listen to, the cause, and mechanisms underlying the discomfort and similarities differences with mechanisms associated with visual discomfort
• test the idea of a domain general mechanism for avoiding uncomfortable sensory stimuli by testing if the the authors previous behavioral finding's of increased auditory discomfort in concert with increased visual sensitivity replicates to ta physiological index of discomfort.
Dv Relevance
• lead author is a potential PI for my 2026 post doc hunt and is going to APCAM 2025.
• a paper that look's at auditory discomfort ( and specifically Misophonia) and visual sensitivity
• discusses Misophonia in the context of the three primary ways to categorize auditory sensitivity, phonophobia, hyperacusis, and Misophonia
• discusses the idea of elevating sensory sensitivity in one modality by treating sensitivity in another modality, assuming shared underlying mechanism causing all sensory discomfort issues.
• finding stronger pattern glare sensitivity links for hyperacusis vs Misophonia suggests clusters of sensory sensitivity (one focused on pain/discomfort, the other on emotions)
• used an NRIS method that is interesting but I need to read up on more to fully understand
Checked For Zettle Notes
true
Zotero Note Link Generated
true
Notes Audited
2026-05-11T09:37:00
Audit Notes
table bullets checked with review audit skill
Auditory discomfort and visual sensitivity
Status:: #status/reviewed
Metadata
- Item Type: #journalArticle
- Authors:: Sarah M. Haigh, Jasmine A. Haggerty, Aimee Delgado,
- Date:
- Date Added: 1761857046000
- URL: https://linkinghub.elsevier.com/retrieve/pii/S0042698925001166
- DOI: 10.1016/j.visres.2025.108655
- Cite Key: haighAuditoryDiscomfortVisual2025
- Topics: [object Object],[object Object]
- Tags:: #Misophonia, #reviewed, #Auditory, #hyperacusis, #Visually-sensitive, #Pattern-glare, #Near-infrared-spectroscopy,
- PDF Attachments
Abstract
| Background/Purpose | Background- • Visual discomfort is well-studied and linked to cortical hyperexcitability. • Auditory discomfort, though clinically relevant, is less understood and under-researched. • Shared sensitivity to both visual and auditory stimuli occurs in both clinical and non-clinical populations. • Sensory discomfort is proposed to result from increased cortical excitability or inadequate inhibitory regulation. Purpose- • Assess overlap between visual and auditory discomfort. • Investigate whether auditory discomfort elicits cortical hyper-responsivity using NIRS. • Determine if discomfort mechanisms are shared across modalities. |
| Participants/samples | • Survey study: 669 undergrads (mean age = 20.1; 465 F, 187 M, 15 NB), screened for neuropsychiatric conditions. • NIRS study: 9 participants (mean age = 21; 6 F, 3 M), no reported neurological/psychiatric conditions. |
| Measures | • Pattern Glare Test (PGT) – number of illusions experienced from a visual grating stimulus. • A-MISO-S – misophonia scale assessing emotional response to specific sounds. • Hyperacusis Questionnaire – pain-related sound sensitivity. • Functional Hearing Questionnaire (FHQ) – impact of auditory sensitivity on daily function. • NIRS – amplitude and timing of haemodynamic responses in auditory cortex to amplitude-modulated tones. |
| Procedures | • Survey study: Online survey collecting responses to auditory sensitivity questionnaires and visual pattern glare. • NIRS study: Repeated presentation of 2 Hz vs. 16 Hz amplitude-modulated 1 kHz tones while recording haemodynamics over TP7/TP8 using NIRS. |
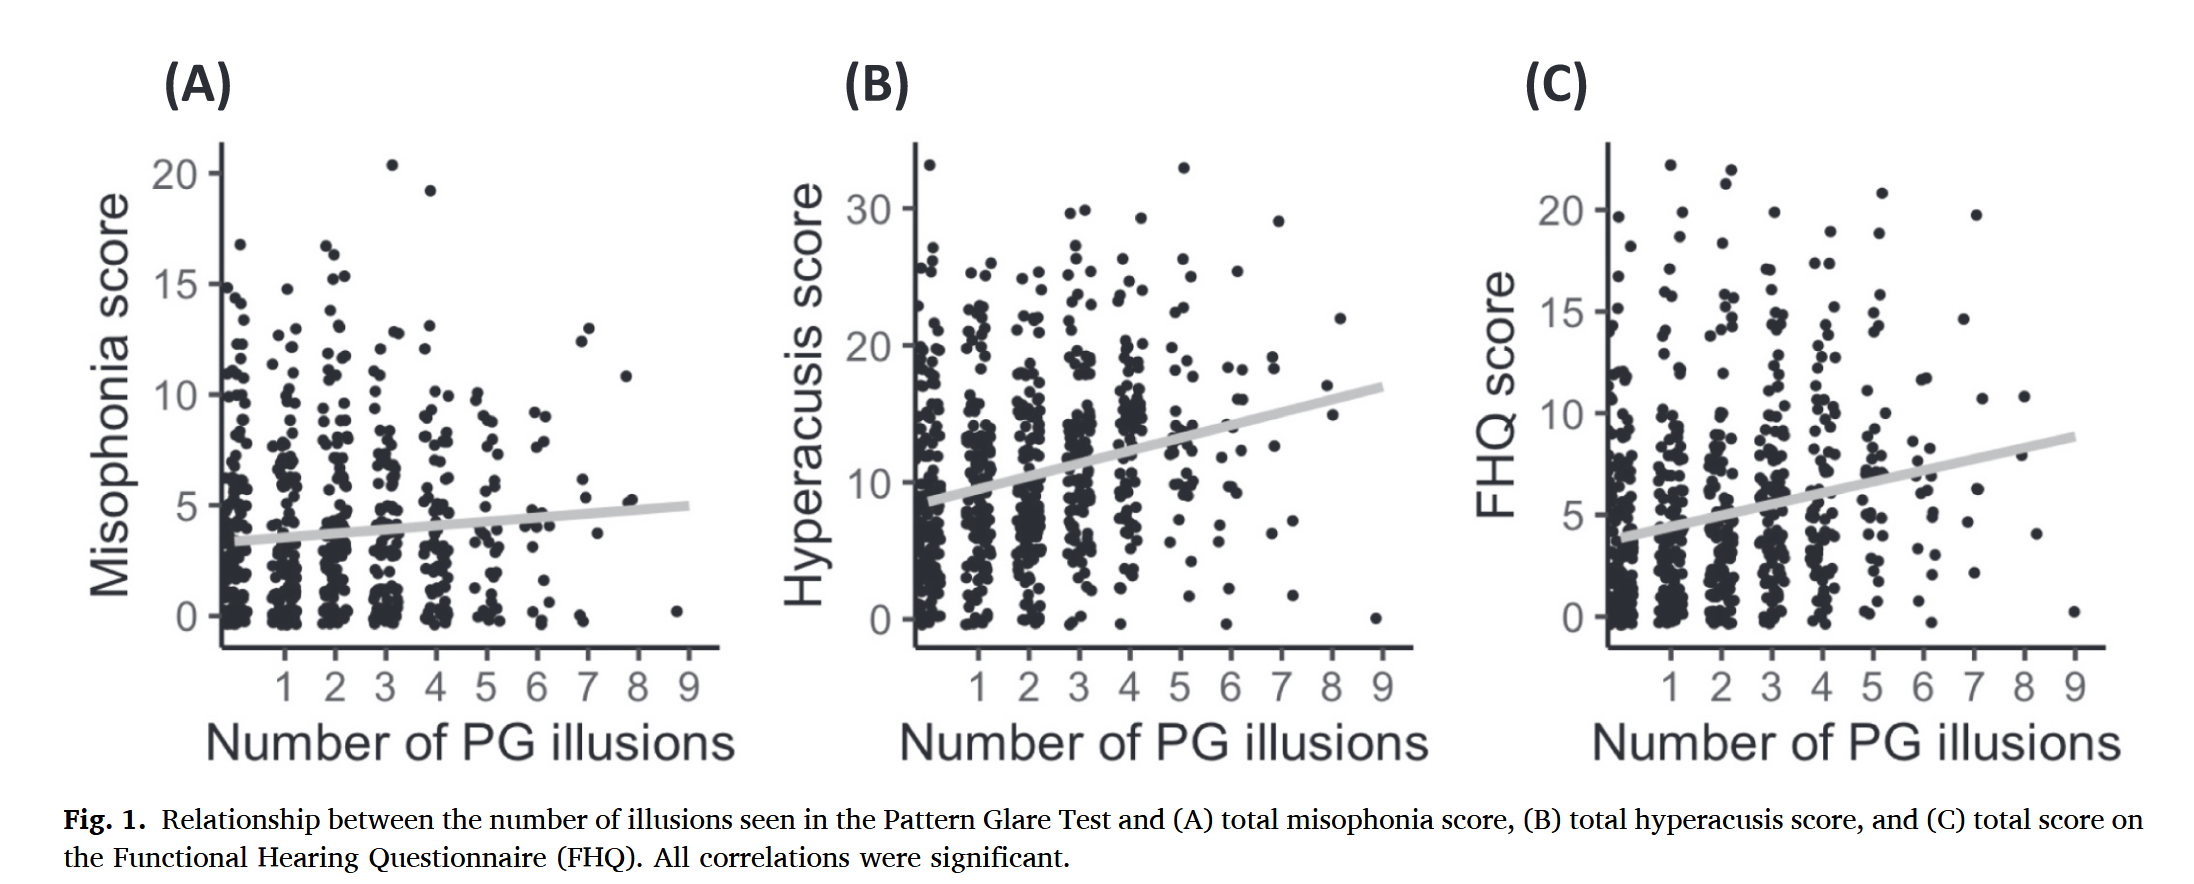
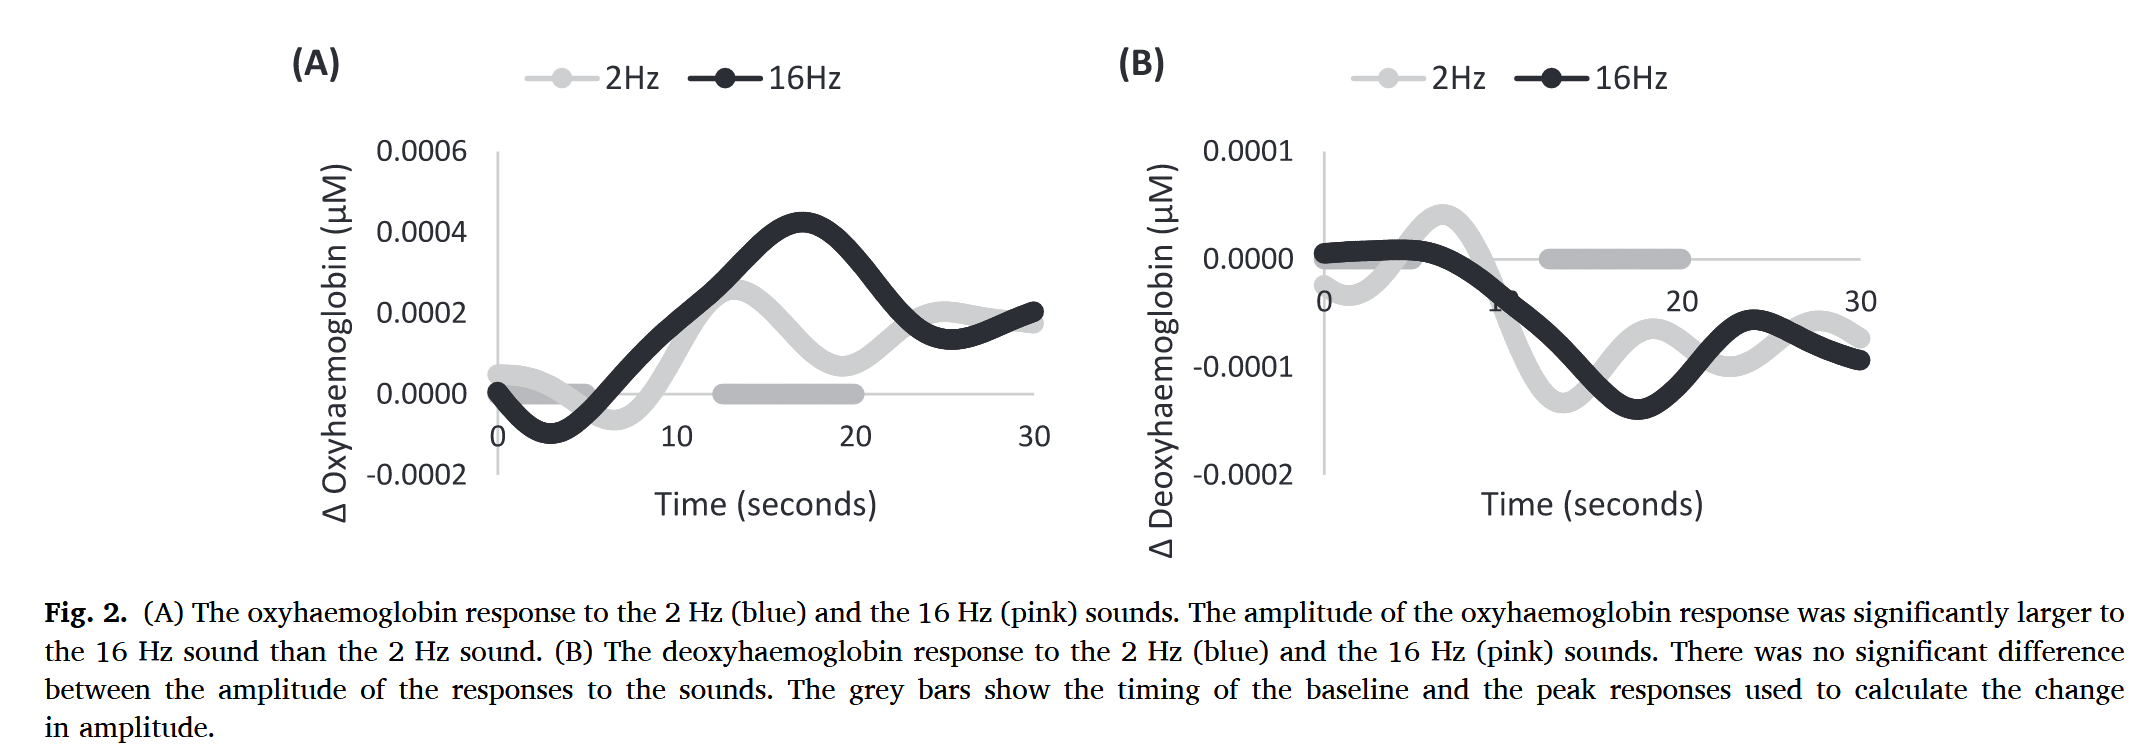
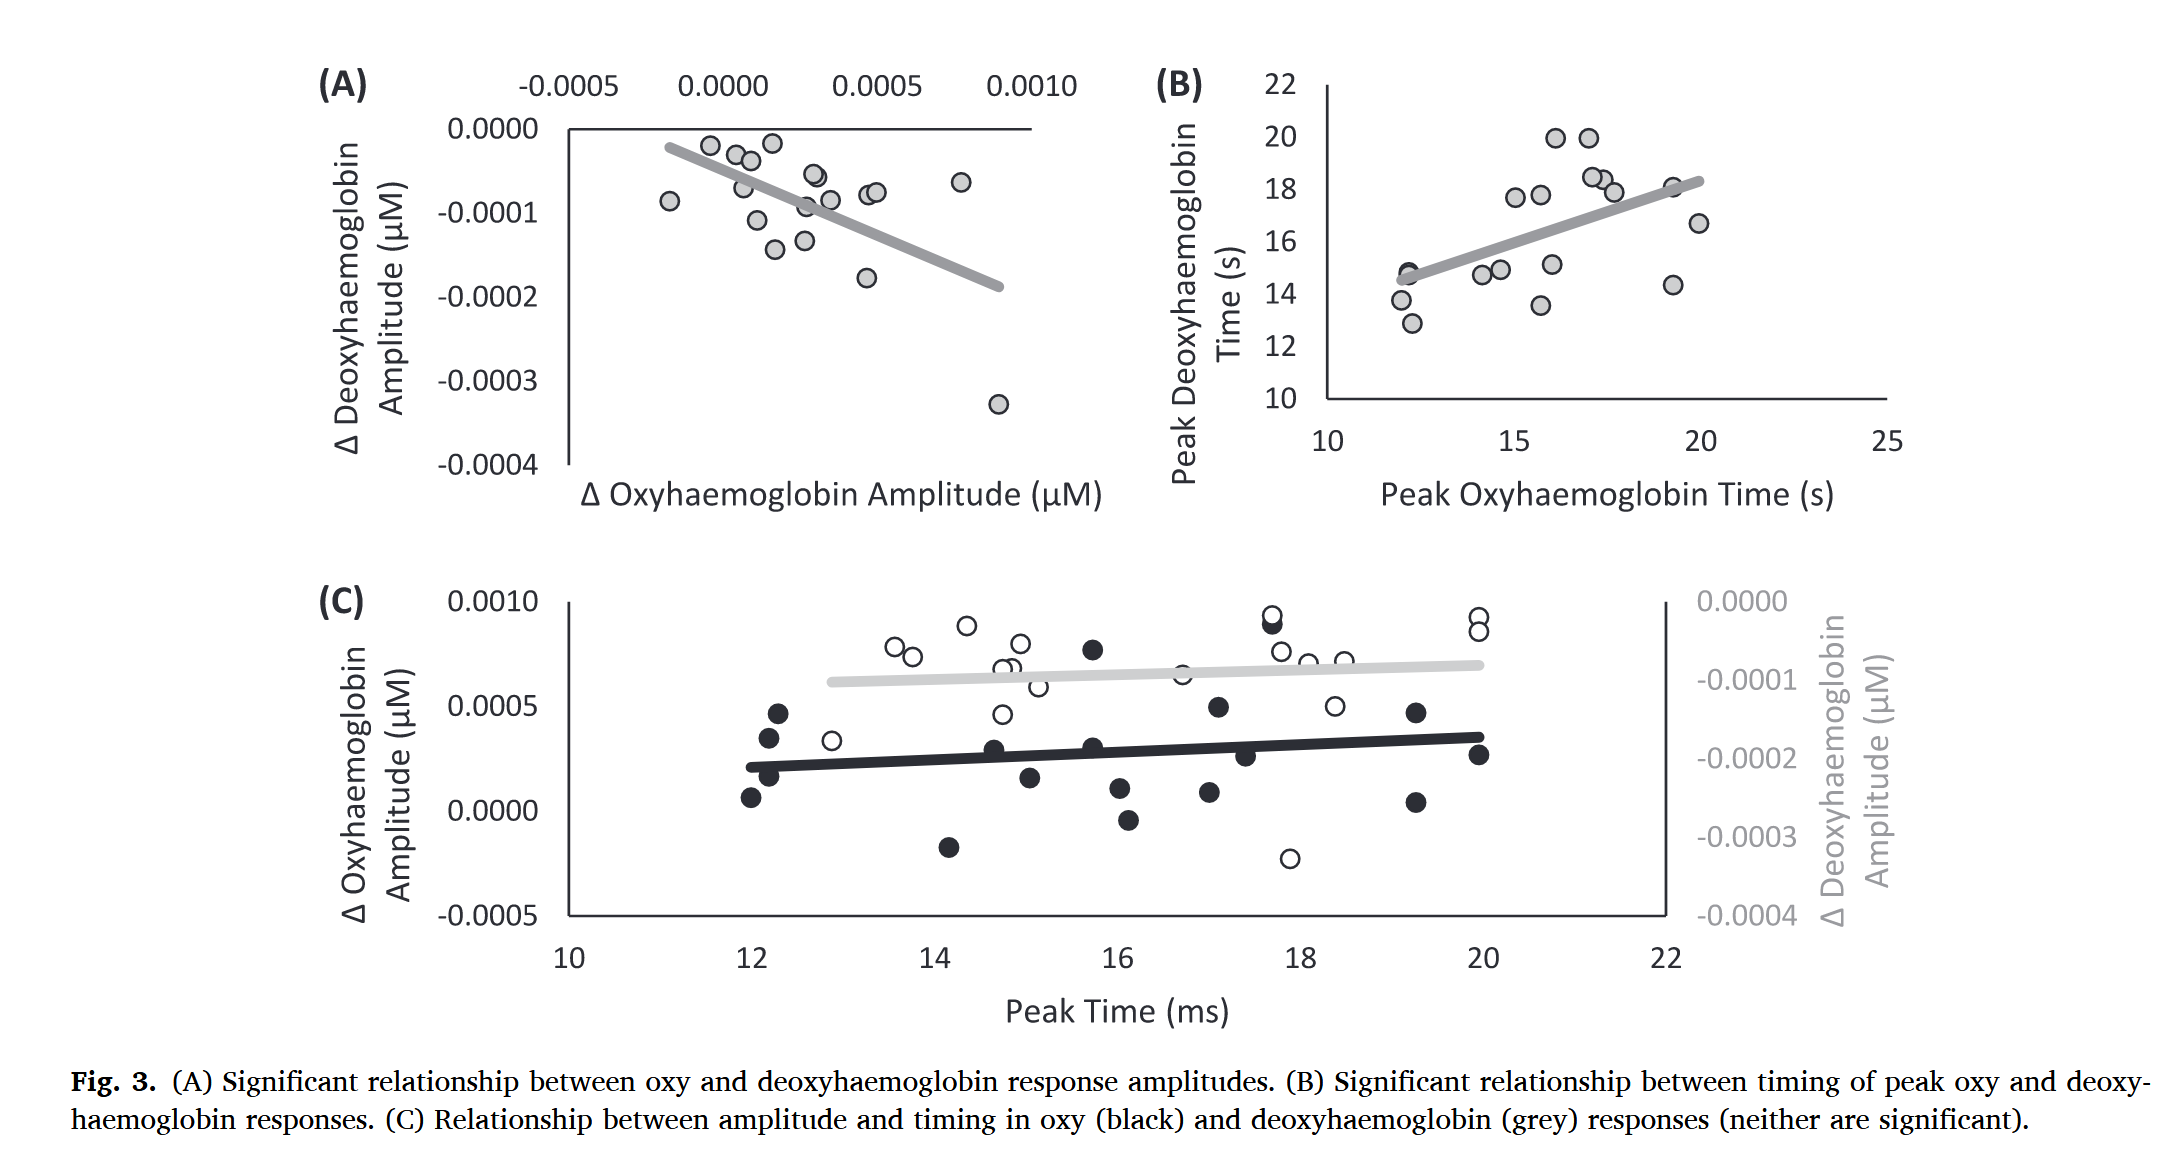
| Results | • All auditory measures significantly correlated with PGT score: • Hyperacusis (rs = .29, p < .001) • FHQ (rs = .25, p < .001) • Misophonia (rs = .11, p = .003) • Correlation between pattern glare and hyperacusis/FHQ significantly stronger than misophonia. • NIRS: 16 Hz (uncomfortable) tone evoked larger (p = .043, d = 1.06) and slower (p = .005, d = 1.36) oxyhemoglobin responses than 2 Hz tone. • No significant differences in deoxyhemoglobin amplitude; trend-level delay in response timing. |
| Discussion/Limits | Conclusion- • Individuals with visual sensitivity (pattern glare) are more likely to report hyperacusis and poor functional hearing, less so misophonia. • Suggests cross-modal sensitivity driven by a shared hyperexcitable cortical mechanism. • Discomfort from sound may reflect similar metabolic overload mechanisms as seen in visual discomfort. • finding stronger pattern glare sensitivity links for hyperacusis vs Misophonia suggests clusters of sensory sensitivity (one focused on pain/discomfort, the other on emotions) • lack of relationship between the latency and amplitude of peak deoxyhemoglobin suggest they reflect different components of auditory discomfort |
| Limitations:: | • Online PGT lacked control over viewing conditions and spatial frequency. • Small sample size for NIRS reduces generalizability. • Misophonia’s emotional component may explain weaker correlations with visual sensitivity. |
| Future Directions:: | • Investigate cross-modal interventions (e.g., tinted lenses for vision, auditory therapies for sound). • Explore whether cortical hyperexcitability generalizes across modalities and trait dimensions. • Assess the role of early auditory processing (e.g., cochlear/brainstem) in discomfort. • Include subclinical psychiatric traits as predictors or modulators of sensory discomfort. • looking into what kinds of auditory stim are uncomfortable to listen to, the cause, and mechanisms underlying the discomfort and similarities differences with mechanisms associated with visual discomfort (pdf) • test the idea of a domain general mechanism for avoiding uncomfortable sensory stimuli by testing if the the authors previous behavioral finding's of increased auditory discomfort in concert with increased visual sensitivity replicates to ta physiological index of discomfort. |
| Relevance:: | • lead author is a potential PI for my 2026 post doc hunt and is going to APCAM 2025. • a paper that look's at auditory discomfort ( and specifically Misophonia) and visual sensitivity • discusses Misophonia in the context of the three primary ways to categorize auditory sensitivity, phonophobia, hyperacusis, and Misophonia • discusses the idea of elevating sensory sensitivity in one modality by treating sensitivity in another modality, assuming shared underlying mechanism causing all sensory discomfort issues. • finding stronger pattern glare sensitivity links for hyperacusis vs Misophonia suggests clusters of sensory sensitivity (one focused on pain/discomfort, the other on emotions) • used an NRIS method that is interesting but I need to read up on more to fully understand |
Notes
key terms and concepts
-
Auditory discomfort - Negative perceptual response to sound, characterized by pain, fear, or emotional aversion.
-
Hyperacusis - Heightened sensitivity to everyday sounds, perceived as louder or more painful than normal.
-
Misophonia - Emotional aversion to specific sounds (e.g., chewing), often accompanied by anger or disgust.
-
Phonophobia - Fear or avoidance of specific sounds, often seen in clinical populations.
-
Pattern glare - Visual discomfort or illusions evoked by viewing repetitive high-contrast patterns.
-
Near Infrared Spectroscopy (NIRS) - Imaging technique measuring cortical hemodynamics (oxy-/deoxyhemoglobin).
my engagement notes
my questions
my comments
- i need to look more into this NIRS method. (page 5)
Bookmarks
- bookmark talking about current state of info on auditory discomfort (page 4)
reading notes
- discusses Misophonia in the context of the three primary ways to categorize auditory sensitivity, phonophobia, hyperacusis, and Misophonia (page )
auditory discomfort current knowledge and directions for the future
- little is known about what makes auditory stim evoke discomfort or why.
- leading theories pose that naturalistic stim are generally more desirable, with unnatural stim being unpleasant
- this stems from an evolutionary adaptation model
- issues arise with the complexity of naturalist sounds, as well as caveats to the pleasantness rule (ex: white noise is unnatural but pleasant) - there is support for a preference of the aud system for harmonious vs unharmonious sounds
- this may still be evolutionary as music may have been around long enough to influence the aud system to encode music the same way it does naturalistic sounds. - the autos propose shifting away from sound categories to focused on specific acoustic parameters that cause discomfort.
- Research indicates that carrier frequencies between 2.5–5.5 kHz and modulation rates between 1–16 Hz are particularly aversive, and that knowing the sound’s source can amplify unpleasantness, revealing a semantic influence.
- Recent findings show that discomfort increases with higher carrier frequencies and faster repetition of frequency sweeps, but that increasing modulation frequency can actually reduce discomfort for higher-pitched tones.
- This pattern parallels visual flicker discomfort, where moderate flicker rates are most unpleasant due to cortical hyper-responsivity in sensitive individuals.
- By analogy, uncomfortable sounds may likewise trigger hyperactivation in auditory cortex as a homeostatic protective response—a hypothesis motivating the authors’ preliminary study on cortical responses to aversive auditory stimuli. (page 4)
- test the idea of a domain general mechanism for avoiding uncomfortable sensory stimuli by testing if the the authors previous behavioral finding's of increased auditory discomfort in concert with increased visual sensitivity replicates to ta physiological index of discomfort. (page 7)
sparse encoding as an underlying mechanism for discomfort
- Computational models suggest that the brain encodes sensory information efficiently using sparse coding, where only a small number of neurons are active at once. When visual stimuli cannot be encoded this way, neural activity increases, creating discomfort as a homeostatic response to avoid metabolically costly stimulation
- A similar process may occur for auditory discomfort: certain sounds might resist sparse encoding, leading to excessive neural activation. - If the discomfort arises from cortical processing, sparse coding could explain it. However, strong sensitivity to pitch might indicate involvement of earlier auditory stages, such as the cochlea or brainstem.
- Research on musical roughness and consonance links auditory nerve activity to perceived pleasantness, Yet sparse coding models have also been applied successfully to early auditory regions—including the brainstem and inferior colliculus, suggesting that discomfort could stem from disrupted encoding at these levels as well.
- Understanding how the auditory system breaks down during uncomfortable stimulation may therefore shed light on the shared neural basis of auditory and visual discomfort. (page 7)
Multisensory Sensitivity
- Evidence supports clustering of pain-related (hyperacusis) vs. emotional (misophonia) sensitivities.
- Trypophobia suggested as a visual analog of misophonia (emotionally aversive but not painful).
Neural Mechanisms
- Discomfort may arise from failure of sparse encoding in sensory cortex—seen in both auditory and visual domains.
- Sparse encoding breakdown could increase metabolic load, eliciting a protective discomfort response.
- Both cortical and subcortical auditory structures may contribute, particularly for pitch-based stimuli.
Practical Implications
- Environmental and therapeutic designs can be optimized by understanding sensory discomfort mechanisms.
- Identifying parameters of